Using Acoustic Recorders to Measure the Operational Underwater Sound of Tidal Stream Turbines
The underwater sound emitted during the operation of the Atlantis AR1500 turbine, a 1.5 MW three-bladed horizontal axis tidal-stream turbine, was measured in the Pentland Firth, Scotland. The most sound was concentrated in the lower frequencies, ranging from 50 to 1000 Hz. Within 20 m of the turbine, third-octave band sound pressure levels were elevated by up to 40 dB relative to ambient conditions. In comparison, ambient noise at these frequencies fluctuates by about 5–10 dB between different tidal states
At the maximum recording distance of 2300 m from the turbine, median sound pressure levels when the turbine was operational were still over 5 dB higher than ambient noise levels alone. A higher frequency, a tonal signal was observed at 20 000 Hz. This signal component appears at a constant level whenever the turbine is operational and did not change with the turbine rotation rate. It is most likely produced by the turbine’s generator. This study highlights the importance of empirical measurements of turbine underwater sound. It illustrates the utility and challenges of using drifting hydrophone systems to spatially map operational turbine signal levels with reduced flow noise artefacts when recording in high flow environments.
Introduction of the Case
Climate change and loss of biodiversity are the most pressing challenges for modern, global societies. The world’s oceans, in particular, are vulnerable to the effects of global warming and loss of species richness and diversity. The global mean surface temperature is projected to arrive at 1.5 C above pre-industrial levels during 2030–2052, and the recent IPCC Special Report clearly stated that limiting warming to 1.5 C is required to maintain substantial amounts of global ecosystems and significantly reduce the risks of climate change to human health and global economies. Due to this urgent need to stabilise global climate change, there is an increasing demand for clean energy, and, correspondingly, the marine renewable energy sector has grown rapidly in recent years.
This development has also raised questions about the potential impacts of these new technologies on marine species, including concerns around auditory injury due to underwater noise during their construction and operation. In the case of tidal-stream energy, environmental concerns have primarily focused on the potential risk of injury to animals related to a collision with moving parts of underwater turbines. However, underwater sound, both the sound pressure and particle motion components, as generated by tidal turbines may also affect marine life, including invertebrates, fish, and marine mammals. While the risk of auditory injury from turbine underwater sound is predicted to be low for marine mammals and fish, other potential impacts include behavioural disturbance, as well as acoustic masking and barrier effects, which may result in habitat exclusion.
With respect to the latter, sounds from tidal turbines might be a mixed blessing, as it may act as a useful cue for animals to avoid collisions with these devices. For example, it has been shown that harbour seals demonstrate avoidance behaviour to sounds from operating tidal turbines, and harbour porpoise click activity within a few hundred metres of an operational turbine was significantly reduced compared to baseline levels. Whether these small-scale effects lead to long-term habitat exclusion or barrier effects is currently unknown, but it is a potential concern for future deployment of large-scale arrays of tidal turbines. However, evidence from a demonstration project suggests that the deployment of a single turbine did not result in large-scale area avoidance by harbour seals. To better understand and predict these potential environmental effects of tidal turbines, it is important to characterise the spatial and temporal variation in their emitted sound along with site-specific ambient noise and sound propagation characteristics of these otherwise rarely studied acoustic environments.
Since impact ranges will be highly dependent on ambient noise, these measurements should ideally be carried out in different seasons and capture a variety of weather and tidal state conditions. Acoustic measurements in environments with strong tidal currents present several difficulties. Next to the logistical difficulties in fixing acoustic moorings to the seabed, stationary hydrophones exposed to moving water experience spurious “flow noise” particularly in the lower frequencies of interest to characterise tidal turbine signals (up to 500–1000 Hz). Flow noise is an artefact arising from the interaction of turbulent flowing water over the hydrophone element (shear stress) and can mask sounds of interest. Measurements using drifting hydrophones reduce these effects but have the disadvantage of intertwining temporal and spatial patterns. The latter can be somewhat relieved by collecting enough data through multiple drifts across areas of the same spatial extent at different times of the day and within the tidal cycle to account for some of the observed variability, as was done in this study.
In relation to the characterisation of tidal turbines, drifting hydrophones have the advantage of allowing measurements of the turbine sound field as a function of range. These measurements can then be used to estimate local propagation loss. Propagation loss is a measure of the reduction of sound intensity between two points; it is influenced by the environment through which a sound is propagating. Accurate measurements of turbine sound at distance from the source and estimates of PL are necessary for back-calculating the source level (SL) of the measuring devices. Since only a few operational tidal stream turbines have so far been deployed worldwide, there is currently little publicly available information on the actual underwater sound emitted by these devices. The only system that has been described in detail in the peer-reviewed literature is the 2.2 MW “Arcouest” tidal current turbine. Information on other systems, such as the SeaGen (MCT), OpenHydro, SCHOTTEL SIT, or the Hammerfest (Andritz Hydro) turbines, resides in the grey literature such as project reports, conference proceedings, environmental impact assessments, and other non-peer-reviewed documents.
The aim of this study was to characterise the operational sound of a single Atlantis2 AR1500 tidal-stream turbine across different tidal states and flow conditions. The secondary aim was to compare and contrast results with measurements of local ambient noise obtained at the same site prior to turbine installation.
Methods to Measure Tidal Turbine Sound Using Hydrophones
Site description
The study was carried out at the MeyGen tidal array in the Pentland Firth, a strait linking the Northeast Atlantic with the North Sea, between mainland Scotland and the Orkney Isles. The strait has a maximum water depth of 80 m in the deep channel. Tidal currents in this area are among the strongest in the world and frequently exceed 5 ms1, yielding estimates of the tidal energy potential of at least 1.9 GW in this area. The MeyGen project is sited between the Island of Stroma and the Scottish mainland in a narrow channel called the Inner Sound. The MeyGen array was installed in 2016 and is currently the largest tidal-stream turbine array (6 MW) in the world, comprised of four 1.5 MW turbines. The MeyGen project aims to initially build out Phase 1 up to 80 MW, with the view of supporting up to 400 MW in later stages of the project (Last viewed: 16 April 2020). The Atlantis AR1500 tidal current turbine was deployed as part of an approximately rectangular array along with three Andritz Hydro Hammerfest AHH 1500 turbines and individual turbines were spaced 200 m apart. The turbine is installed at a water depth of 37.2 m, with the rotor centre at a depth of 17 m, and the rotor diameter is 18 m. At the time of the study, the water depth above the rotor centre varied between 22.5 and 24 m. The AHH1500 turbines were deployed but not operational at the time that the acoustic recordings of the Atlantis AR1500 turbine were made.
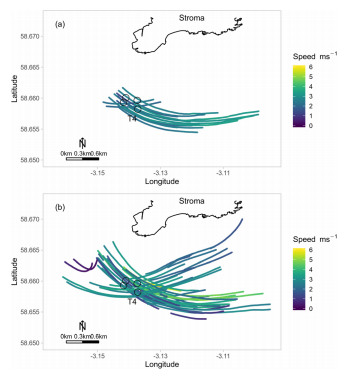
Map of the study area in the Pentland Firth, Scotland. (a) Drifter trajectories while demonstration Atlantis AR1500 turbine (T4) was operational (2018-08-06). (b) Drifter trajectories during ambient noise recordings (2015-10-01, 2016-05-24, 2016-06-23, 2016-06- 24). Locations of three Andritz Hydro Hammerfest AHH1500 turbines, which were deployed but inactive during turbine measurements, are also marked on the map as hollow circles.
Acoustic Measurements
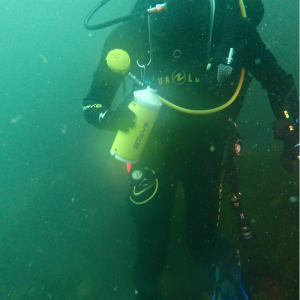
In an effort to reduce flow noise, turbine sound and ambient noise were measured using multiple freely moving Lagrangian drifters each with an autonomous acoustic recorder and hydrophone setup, designed to keep the hydrophone fixed to the moving body of water. Recorders (RTSYS EA-SDA14) and hydrophones (Reson TC4032 and TC4014; sensitivities TC4032: 162.6 and 169.5 dB re 1 V/1lPa; and TC4014: 179.9 dB re 1 V/1lPa) were placed inside underwater drogues, connected to surface floats via shock cords, which in turn were attached to tag-along surface floats with GPS (Garmin Etrex 10) and Iridium satellite units for real-time tracking and recording accurate track information at 1–2 s resolution. The hydrophone was suspended approximately 6 m below the surface. Sound files were recorded as .wav files and stored on SD cards. Sound measurements were amplified (gain: 14.7 dB) and digitised using the RTSYS EA-SDA14 recorders at a sampling rate of 312 500 Hz with a resolution of 32 bit.
The sound acquisition chain (Reson hydrophones plus RTSYS recorders) was calibrated using the information provided by the recorder and hydrophone manufacturers. At the start of each recording day, acoustic recorders were GPS synchronised and set to UTC time to ensure accurate time sampling. Acoustic baseline surveys before turbine installation were carried out on 2015–10-01, 2016–05-24, 2016–26-23, and 2016–26-24 covering an area of approximately 12 km2 around the turbine (T4) deployment site. The acoustic survey of the Atlantis AR1500 turbine was carried out on 2018–08-06. The drifts covered an area of approximately 10 km2 around the turbine and overlapped in space with the earlier ambient noise surveys. At the time of the survey, only the Atlantis AR1500 turbine was active. Turbine operational data [e.g., turbine rotation per minute (RPM)] were provided by Simec Atlantis Energy and ranged from 3 to 10 min1 throughout the recording period.
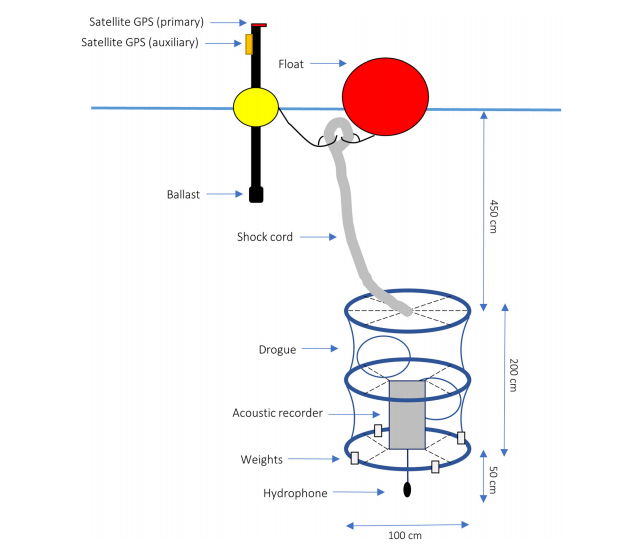
Schema of the Lagrangian drifter equipped with satellite GPS systems for accurate positioning, and carrying the hydrophone and acoustic recording system used to record ambient noise and turbine signals in this study. Figure adapted from Wilson et al. (2014).
Quality of the Acoustic Data
All acoustic measurements used in this study were recorded at sea states representative of 3 or below on the Beaufort wind force scale. The Beaufort wind force scale was used to describe sea state throughout this manuscript, as is common practice in marine ecological surveys. After deployment of the drifters (one to three at a time), the deployment vessel, a rigid hull inflatable boat (RHIB), was manoeuvred away from the drifters before the engine and echosounder were switched off. The separation distance between the boat and the drifters was such that the drifters were in the line of sight to ensure a safe recovery, but kept beyond 100m to minimise noise contamination from the vessel. The Pentland Firth is traversed by several ferry lines connecting mainland Scotland with the Orkney Isles. In addition to ferries, fishing vessels and other small boats were sometimes in the vicinity of the drifting hydrophones. For this reason, all-acoustic spectra were manually screened using Raven Pro v. 1.5 and sections with contaminating vessel noise or drifter self-noise (immediately the following deployment or before recovery) were excluded from further analysis.
Acoustic Analyses and Data Manipulation
Spectrograms (10–1000 Hz; 10–5000 Hz; 10–40 000 Hz) over each entire drift were generated and viewed using PAMGuide, with a 1-s Hann window and 0% overlap, yielding a frequency resolution of 1 Hz. After the initial inspection of the acoustic raw data, sound pressure levels (SPLs) were quantified in third-octave bands with centre frequencies from 25 to 125 000 Hz over a 1-s time window, using the third-octave level (TOL) function in PAMGuide. Acoustic analysis results were georeferenced by comparing timestamps of the recordings to timestamps of the Iridium satellite or GPS units, and each transect was divided into 10-m non-overlapping segments.
The median SPL (dB re 1 lPa) was then calculated for each third-octave band and each 10-m segment. These data were subsequently aggregated by tidal and turbine rotational state to evaluate noise level variations with and without operational turbine signals present. Spatial variations in low-frequency sound levels were evaluated by calculating a broadband (100–1000 Hz) SPL using PAMGuide and plotted against distance from turbine location. This frequency range was chosen as it contained the most energy and was high enough to avoid potential flow noise issues. The higher signal levels measured within the third-octave band centred around 20 000 Hz, where a distinctive tonal signal was observed, were also plotted against distance to the turbine. Except for sound level analyses and spectrogram generation, all data aggregation, manipulation, and figure production were performed in R (R Core Team, 2019) using the tidyverse, adehabitatLT, amt, and move packages.
Results of the Study
Acoustic Data and Signal Characterisation
During ambient noise baseline surveys in October 2015 and May and June 2016, 54 drifts were performed covering both flood and ebb tides in similar weather conditions. Current speeds, as measured by the drifters, ranged from 0.2 to 6.1 ms1. The acoustic survey to measure the Atlantis AR1500 turbine on 2018-08-06 yielded 15 drifts in Beaufort 2 and below, with current speeds ranging from 1.2 to 3.8 ms1. The example spectrogram in Fig. 3, shows drift ‘D13’ (covering 1.5 km in 9.4 min) with the closest point of approach [CPA (horizontal distance)¼ 7.6 m] to the active Atlantis AR1500 turbine. This drift was recorded during neap flood tide and with a median of Beaufort 2. The turbine sound was clearly discernible and peaked at the CPA (i.e., over the turbine). Highest broadband sound levels were observed in the range 50–1000 Hz. The turbine signal was tonal with an oscillating (bandwidth: 25–75 Hz) fundamental frequency at about 100 Hz, and several harmonics clearly visible up to 2000 Hz. In close range to the turbine (<200 m), an additional tonal signal was observed at approximately 20 000 Hz.
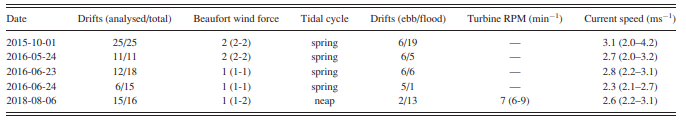
Summary of drifts. Beaufort wind force, turbine RPM (min1 ), and current speed (ms1 ) measurements are median values with 25th and 75th percentiles in parentheses.
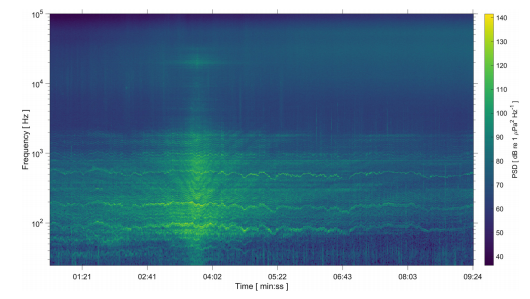
Power spectral densities (PSD in dB re 1 lPa2 Hz1 ) over the range of 25 Hz–100 kHz using a 1-s Hann window and 0% overlap, for drift ‘D13’. The drift shown in this spectrogram was recorded on 2018-08-06 during neap flood tide, with a median wind force of 2 Beaufort, while the Atlantis AR1500 turbine was operational. The drift started about 500 m upstream and ended about 900 m downstream of the operating turbine with the closest point of approach (CPA) between acoustic recorder and turbine of approximately 7.6 m after about 4 min.
Variation of Turbine Sound with Rotational and Current Speed
To evaluate turbine signal levels in relation to the current speed and turbine rotations per minute (RPM; min1 ), the spectra of turbine sound, measured during flood tide and a Beaufort 2 or below, within 0–20 m and those measured at a distance of 100–120 m, respectively. It is evident that sound levels across the full spectrum were about 10–20 dB higher when measured within 20 m from the active turbine compared to those measured 100–120 m from it. Generally, turbine sound levels were reduced when the RPM was lower, while the shape of the frequency spectrum was similar. At current speeds of 2–3 ms1 , there was a 5–15 dB difference in signal levels at peak frequencies [100–200 Hz. Turbine rotational speed was positively linked to the current speed and rotational speeds of 7–9 min1 were only observed at current speeds of at least 2–3 ms1. At current speeds of 3–4 ms1 , rotational speed was always 7–9 min1 (Fig. 4), while it was equal or below 5–7 min1 at current speeds of 1–2 ms1.
Turbine Sound in Relation to Ambient Noise and Tidal State
Median broadband sound levels (100–1000 Hz) close to the turbine (60 m) were raised by about 35–40 dB above ambient levels while the turbine was running. The median broadband SPL (100–1000 Hz) during a flood at this distance was 138 dB re 1 lPa, compared to 100 dB re 1 lPa during ambient conditions. In contrast, the difference in median sound levels, when comparing ebb to flood under the same conditions, was 10 dB or less, independent of whether the turbine was operational or not.
Spatial Footprint of Turbine Sound
As expected, turbine signal levels were highest close to the turbine and decreased with distance. Broadband SPLs in the 100–1000 Hz frequency range, and measured during flood tide with current speeds from 1 to 4 ms1 and 2 Beaufort or below, were about 136 dB re 1 lPa within 100 m from the turbine and about 109 dB re 1 lPa at a distance of 2200–2300 m. At this distance, median turbine signal levels were still over 5 dB above-median ambient noise levels (100–105 dB re 1 lPa), measured for this frequency band under similar conditions, and across the same spatial range. The median SPLs for the third-octave band centred at 20 000 Hz were about 126 dB re 1 lPa within 25 m from the turbine and about 112 dB re 1 lPa at 200 m from the turbine, after which signal levels were similar to median ambient noise levels measured under comparable conditions. Ambient noise levels in this frequency band showed great variability, likely caused by local turbulence caused by tidal features such as eddies and standing waves.
Discussion
Acoustic measurements using drifting hydrophones in a dynamic tidal channel showed that, in low wind conditions (2 Beaufort) and under medium flow conditions (1–4 ms1 ), low-frequency underwater sound (100–1000 Hz) from the active Atlantis AR1500 turbine was clearly detectable above ambient noise out to distances of at least 2300 m. Due to greater low-frequency ambient noise in higher sea states, these detection distances are likely to be less in higher wind conditions (i.e., 5 Beaufort and above).
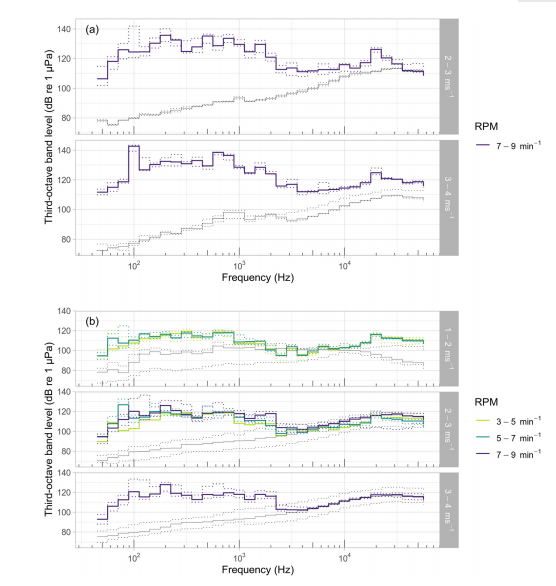
Median third-octave sound pressure levels (50 Hz–63 kHz; TOL in dB re 1 lPa) (thick lines), and 5th and 95th percentiles (dotted lines), calculated over a 1-s integration window. Plots are faceted by the current speed in ms1 (as measured by drifters) and coloured by turbine rotational speed in min1 (RPM). All data collected during flood tides and 2 Beaufort or below. (a) Data recorded between 0 and 20 m, and (b) between 100 and 120 m from the operational Atlantis AR1500 turbine. Grey solid lines are median ambient third-octave band levels collected under similar conditions and across the same spatial range. Grey dotted lines indicate 5th and 95th percentiles of ambient noise levels.
The turbine signal was tonal (fundamental frequency around 100 Hz) with several harmonics up to 2000 Hz. There was also another tonal signal observed at 20 000 Hz close (within 200 metres) to the turbine. The frequency and amplitude modulated, lower frequency tonal signals recorded in this study from the Atlantis AR1500 turbine resembled those described for other operational horizontal axis tidal-stream turbines. For example, it has been shown that the signal of the SCHOTTEL SIT turbine also shows frequency modulation. Sound emissions of the SCHOTTEL turbine also varied in relation to its operational mode (e.g., constant spinning, freewheeling, braking). In the current study, only the turbine rotations per minute but not the operational state of the Atlantis AR1500 turbine was known. It would therefore be useful in future studies to assess the signal type and levels for different operational states of the active turbine using a robust experimental design. Describing typical turbine sounds might then also be a useful diagnostic tool to monitor and assess the health status of these turbines.
There was a clear relationship between current speed and RPM, with an increase of 10–20 dB at higher RPM and flow speeds. This might be beneficial, as it makes the signal more detectable above ambient noise during high flow conditions. Turbine sound and local ambient noise levels, measured in this study at low wind conditions and sea states, suggest detectability of the turbine signal by seals as well as porpoises at distances of at least several hundred metres from the turbine, independent of the tidal state. A recent study showed that harbour seals avoid simulated tidal turbine sound at distances of over 500 m, but also highlighted the potential costs of chronically elevated noise levels and area avoidance, such as reduced foraging opportunities or barrier effects. Finally, it is important to consider increasing array size and the use of acoustic measurements of single turbines, such as performed in the current study, to predict underwater sound related to larger-scale tidal turbine arrays. Such data could inform future array design to mitigate potential habitat exclusion for marine wildlife.
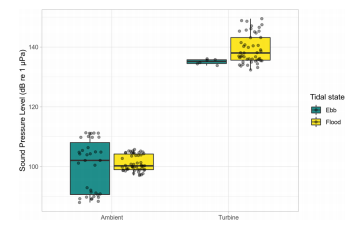
Grouped boxplot of broadband sound pressure levels (SPL in dB re 1 lPa) measured for the frequency range of 100–1000 Hz (1-s integration window), within 60 m of the Atlantis AR1500 turbine location, at 2 Beaufort or below and current speeds of 1–4 ms1 . Lower and upper bounds of boxes represent lower and upper quartiles, respectively. Solid lines represent medians, and whiskers indicate furthest data points within 1.5 interquartile range. Jittered data points plotted on top of boxplot. Data aggregated by tidal and turbine operational state.
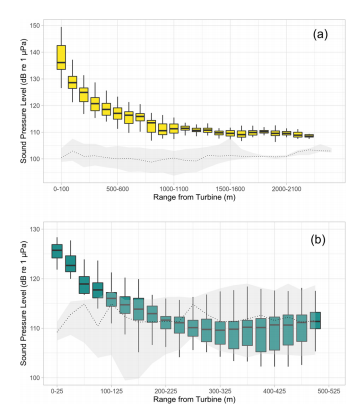
Boxplot of (a) broadband sound pressure levels (SPL in dB re 1 lPa) measured for the frequency range of 100–1000 Hz, and (b) sound pressure levels (SPL in dB re 1 lPa) for the third-octave band centred at 20 kHz against range from the operational Atlantis AR1500 turbine. Data collected during flood tide (2 Beaufort or below; current speeds: 1–4 ms1 ) and SPL calculated using a 1-s integration window. Lower and upper bounds of boxes represent lower and upper quartiles, respectively. Solid lines represent medians, and whiskers indicate furthest data points within 1.5 interquartile range. The dotted lines and grey ribbons represent the median, and 5th and 95th percentiles of the ambient noise SPLs collected prior to turbine installation across the same frequency ranges and spatial scales and in similar recording conditions.
Conclusion
This study contributes to the small number of in situ measurements of radiated sound emitted by tidal-stream turbines. The active Atlantis AR1500 turbine produces a frequency modulated tonal signal with harmonics as well as peak sound levels between 100 and 1000 Hz. The turbine emissions elevate noise levels by about 30–40 dB above ambient in low sea states, making the signal measurable at ranges of over 2000 m from the turbine. Sound levels are linked to and increase with turbine RPM and current speeds. An additional and unexpected tonal signal was observed at about 20 000 Hz, within an approximate radius of 200 m from the turbine. Further work is needed to describe the emitted signal during different turbine operating modes, identify exact sound generation processes, and estimate signal levels of incrementally larger turbine arrays. Evaluating the validity of sound propagation models to estimate turbine source levels will also be essential for such extrapolations and realistic ecological impact assessments of operational tidal-stream turbine arrays.
Acknowledgements
This paper was presented at the 5th International Meeting on the Effects of Noise on Aquatic Life, held in Den Haag, July 2019. The ambient noise data collection for this project was supported by funding from the EU FP7- REGPOT program for the MERIKA project (2014–2017) awarded to the University of the Highlands and Islands (UHI) under Grant Agreement No. 315925. The project received additional funds from the Scottish Government to support the collection of operational turbine sound data and manuscript preparation. We thank Erica Cruz from WavEC, the crews of the Environmental Research Institute’s (ERI) RV Aurora and Marine Scotland’s RV Scotia [trip 0816S; partly funded by the KTP project (No. 1010381/KTP9812) between Aberdeen University and MeyGent Ltd.], as well as personnel from Aberdeen University and the Sea Mammal Research Unit (SMRU) of the University of St Andrews for fieldwork support. Many thanks to Cara Donovan and Daniel Coles from Simec Atlantis Energy for sharing turbine operational data and their encouragement and support throughout the study.
Do you have questions about this case study?
Get in touch with RTsys, and they would be happy to answer any questions you have about pricing, suitability, availability, specs, etc.


![Do-Giant-Tortoises-Make-Good-Neighbors-1[1].jpg](https://cdn.geo-matching.com/vRMO2Edp.jpg?w=320&s=a6108b2726133ff723670b57bc54c812)


