
Bathymetric Survey in Base Stone Investigation by Riverside with MS400U MBES + USV
This project requires an integrated survey of the above-water and underwater topography of the embankment on the north bank of an inland waterway. The underwater part is subject to multi-beam survey. The main purpose is to obtain the underwater three-dimensional terrain around the embankment to determine the erosion of the embankment and base stone condition.
MS400U multi-beam sounding system has the following advantages:
Small size, light weight, easy to install, and the equipment installation can be completed in a short time.
Supports tilted installation, which can be used for tilted installation on embankments and root rocks to improve scanning pertinence and accuracy.
High performance, accurate bathymetric data can still be obtained under high sand content.
Built-in high-precision attitude meter can still provide accurate attitude information under high flow rates and obtain extremely high splicing quality.
The slope on the northern bank of the river is protected by riprap. There is a railway bridge across the Yellow River on the east side. There is a spur dam upstream of the railway bridge to prevent erosion of the foundation under the railway bridge. The specific scanning position is shown below:
.png")
1.Survey Requirement
1.1. System debug
(1) First, check whether the sonar echo is normal, confirm if data input and connection port settings are correct, check if the coordinate system settings and ship position relationship are correct, check the coordinates and confirm whether the attitude and heading data are correct;
(2) Carry out multi-beam calibration measurement. In the area of change, lay out two planned measurement lines with a line spacing of 4 meters, conduct round-trip measurements with constant speed, and obtain four calibration measurement data. The following are the calibration measurement lines:
.png")
1.2. Survey and survey precision inspection
(1)In collaboration with MS400U MBES to measure underwater topographic change. The following is the field software work record and the autonomous navigation status of the unmanned ship:
.png")

(2)After completing the measurement in the survey area, conduct check line measurement along the direction of the vertical survey line. The following is the measurement check line:

1.3. Data processing
Currently, the mainstream software for data processing is HYPACK or QINSY. This multi-beam data processing uses HYPACK to remove noise and result output.

1.3.1 Installation deviation calibration
Calculate roll, pitch, and yaw calibration values. Due to the application of PPS technology, the time delay does not need to be calibrated. The calibration value calculation interface is as follows:

1.3.2. Data processing course
(1) First step use SWEEP function to remove noise from the measurement data strip by strip, and in-house technicians need to do this for all measurement data. The following is a screenshot of the strip editing window:

(2) The second step is to use the section editing window to delete section noise points on all data and delete false data missed in strip editing to ensure the accuracy of the measurement data. The section editing interface is as follows:

(3)Last step is to output the data which after processing and generate document in corresponding format.
2. Data analysis
2.1. Result presentation
(1) Point cloud data model. The data contains three-dimensional coordinate information, which is the measurement result of all bathymetry projects. At the same time, model can be created based on point cloud data. Some point cloud screenshots are as follows:

(2) TIN model is a 3D model created according to the measurement results based on elevation changes. The depth information can be identified as follows:
.png")
(3) Isobath model. The generated point cloud data can be automatically produced into a contour model of the measured area to facilitate further data analysis.
.png")
2.2. Data analysis
2.2.1. Data quality analysis
(1) The noise data is less and the features are obvious which is easy to indentified, the processing work are greatly reduced, as shown in the following figure:
.png")
(2) The cross-section of the measurement data has a high matching degree, and the stitching error between the survey line data is less than 5cm. The different colors below represent different measurement data:
.png")
.png")
2.2.2. Data precision analysis
(1) Comparison method, create TIN models for two sets of multi-beam data results, and perform difference processing on the TIN models. Blue is the measurement range, red is the inspection line area. The renderings of the two sets of multi-beam data results. And the scope is as follows:
.png")
(2) Difference calculation performs difference analysis to the data within the range of 1m*1m, as shown below:
.png")
(3) After statistics, the proportion of values with error values less than or equal to ±0.1m is 95.71%, and the proportion of values greater than ±0.28m is 0.52%, which is far lower than the 15% non-compliance limit standard required by the specification. Statistics The results are as follows:

2.3. Scouring analysis
2.3.1. General analysis
According to the 3D modeling, it can be found that the dam bottom in the following areas has undergone rapid elevation changes. Since there is a spur dam protecting the base of the railway bridge downstream, it is suspected that the backflow phenomenon occurred here, as a result, the erosion here is more serious.
.png")
.png")
.png")
Through the measurement tool that comes with the software, you can easily measure the distance to any point in the results. In the picture below, the width of the suspected scour pit can be measured to be 105m and the length is 200m, and the available area is about 310㎡.


Through the TIN model tool, the cross-section data of the model can be generated according to different elevations, and the volume of the scour can be further calculated, as shown below:

3. Integrated data display both above and under water
3.1. General layout in the survey area

3.2. UAV 3D laser scanning data display

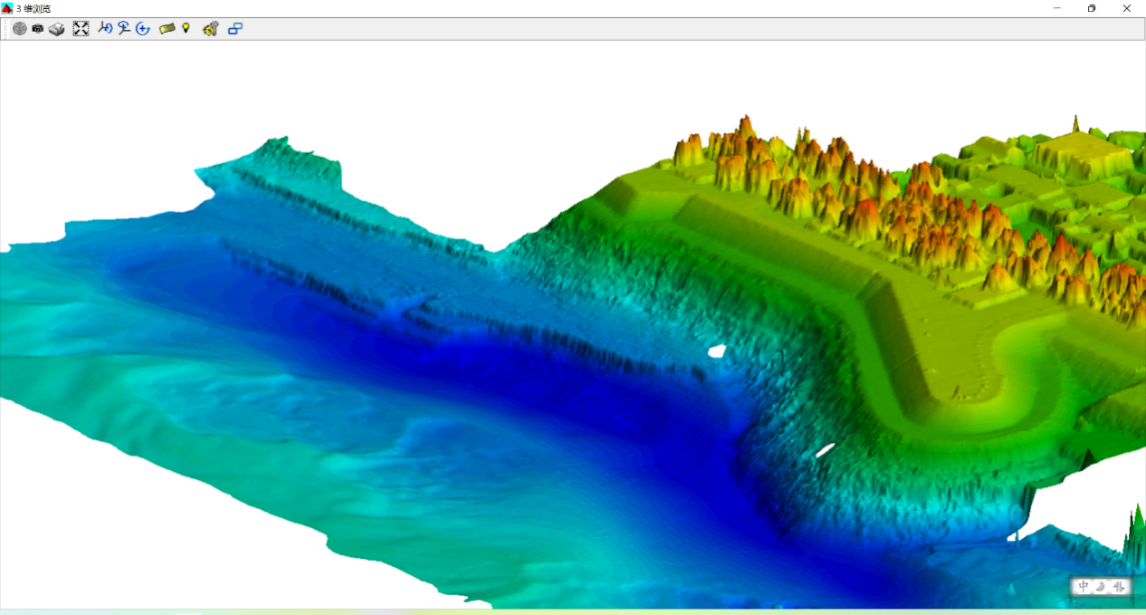
3.3. Integrated point cloud data display
The red line represents the water surface line, below the red line is the multi-beam measurement data results, and above the red line is UAV laser scanning data results.


3.4. Integrated TIN model display

4. Conclusion
The complete underwater three-dimensional terrain can be obtained by carrying multiple beams on an unmanned ship. Qualitative analysis of damaged areas can be performed on the Yellow River dams.
Through further processing and calculation, accurate numerical values and information such as damage volume, area, and status can be obtained.
The operation efficiency is high, and the underwater terrain can be quickly acquired after completing the installation and debugging of the equipment in a short time.
The above and below water measurement data have high accuracy and good splicing quality.
Through the integrated measurement of water and water, the deformation of the water and water parts of the Yellow River dam body can be monitored without blind spots.
Do you have questions about this case study?
Get in touch with Hydro-Tech, and they would be happy to answer any questions you have about pricing, suitability, availability, specs, etc.


![Do-Giant-Tortoises-Make-Good-Neighbors-1[1].jpg](https://cdn.geo-matching.com/vRMO2Edp.jpg?w=320&s=a6108b2726133ff723670b57bc54c812)


