

Bathymetric Survey and Acoustic Backscatter - California
In 2010 and 2011, scientists from the U.S. Geological Survey (USGS), Pacific Coastal and Marine Science Center (PCMSC), acquired bathymetry and acoustic-backscatter data from the outer shelf region of the eastern Santa Barbara Channel, California. These surveys were conducted in cooperation with the Bureau of Ocean Energy Management (BOEM). BOEM is interested in maps of hard-bottom substrates, particularly natural outcrops that support reef communities in areas near oil and gas extraction activity. The surveys were conducted using the USGS R/V Parke Snavely outfitted with an interferometric sidescan sonar for swath mapping and realtime kinematic navigation equipment. This report provides the bathymetry and backscatter data acquired during these surveys in several formats, a summary of the mapping mission, maps of bathymetry and backscatter, and Federal Geographic Data Committee (FGDC) metadata.
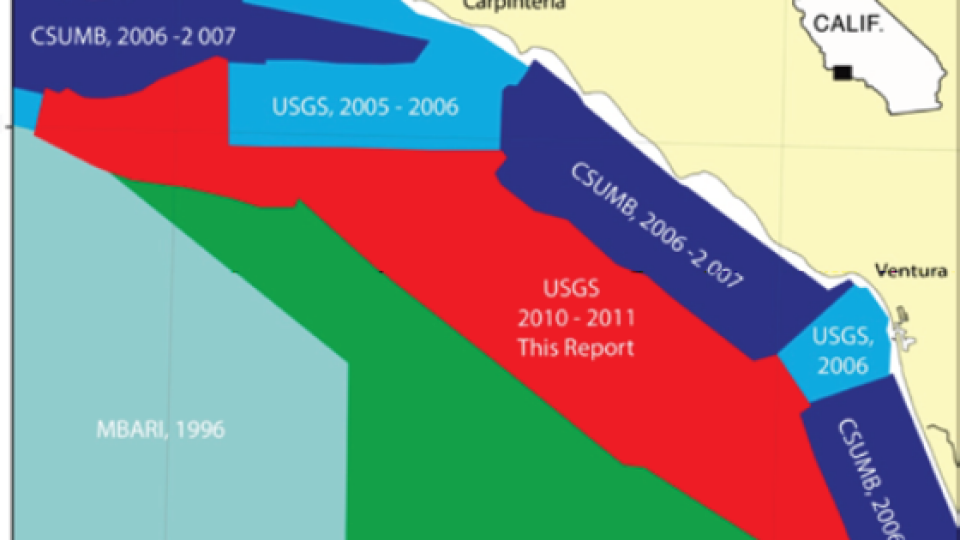
he U.S. Geological Survey (USGS), Pacific Coastal and Marine Science Center (PCMSC), in cooperation with the Bureau of Ocean Energy Management (BOEM), completed mapping of the outer shelf region of the eastern Santa Barbara Channel, southern California. High-resolution bathymetry and co-registered acoustic backscatter data were collected from south of Santa Barbara to west of Oxnard, mainly seaward of the 3-nautical-mile limit of California’s State Waters (fig. 1).

Figure 1. Location map of the 2010 and 2011 USGS mapping (colored red). Other colored polygons show previously mapped regions of the Santa Barbara Channel, including institution and year. CSUMB, California State University, Monterey Bay; MBARI, Monterey Bay Aquarium Research Institute; USGS, U.S. Geological Survey.
This was the last remaining area to be mapped in the Santa Barbara Channel with high-resolution mapping tools, except for regions around the northern Channel Islands. The USGS surveys abutted data previously collected within California State Waters by California State University, Monterey Bay, Seafloor Mapping Lab; Fugro Pelagos, Inc.; and the USGS and further offshore by the Monterey Bay Aquarium Research Institute (MBARI) and the USGS (fig. 1). While most of the newly mapped region consisted of low relief, lower-backscatter seafloor, local regions of higher relief with higher backscatter intensities were mapped in the northern extent of the survey area. Pipelines and (or) cables were mapped throughout the region. A field of scattered mounds of higher backscatter intensities was mapped in the southern extent of the survey area.
These new data can be used to help researchers, coastalzone managers, and other stakeholders better understand the coastal environment including identifying hard-bottom substrates, such as natural outcrops that support reef communities; prediction of sediment and contaminant budgets and transport; and assessment of earthquake and tsunami hazards in the region. This report provides the USGS 2010 and 2011 bathymetry and backscatter data in several formats along with a summary of the mapping mission, maps of bathymetry and backscatter, and Federal Geographic Data Committee (FGDC) metadata. This report also provides a new overall 10-m resolution bathymetric Digital Terrain Model (DTM) of the Santa Barbara Channel incorporating these new bathymetry data with other available bathymetric data.
Bathymetric Mapping Mission
Due to the overall size of the mapping area within shallower waters, the mapping took place over a two-year period between 2010 and 2011 (PCMSC Field Activity IDs:
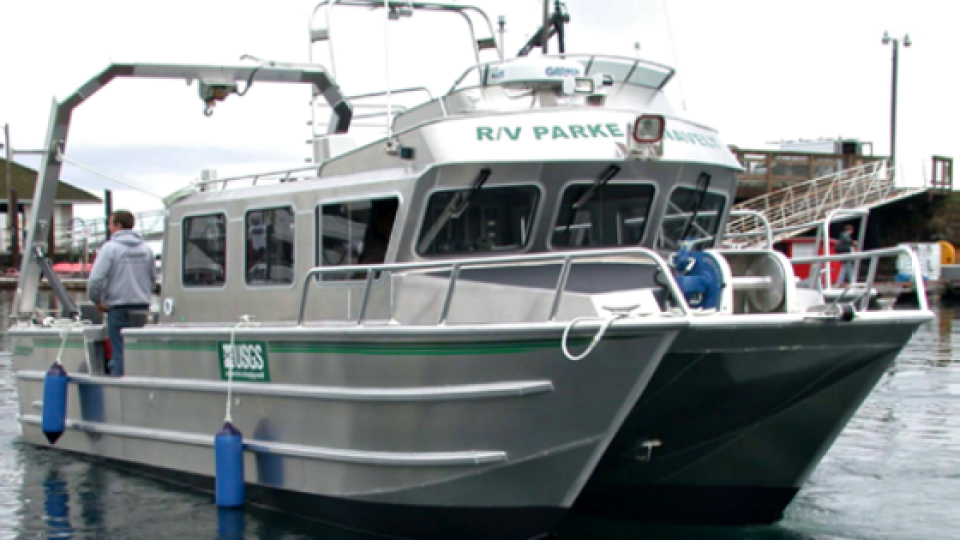
S-14-10-SC and S-08-11-SC). Both surveys were conducted using a 234.5 kHz SEA (Systems Engineering and Assessment (Advanced Products) Ltd.) SWATHplus-M phase-differencing sidescan sonar. The sonar was mounted on the 34-ft USGS mapping vessel R/V Parke Snavely (fig. 2) and affixed to a hull brace. Real-time kinematic (RTK) GPS position data were passed through a CodaOctopus F190 inertial measurement unit (IMU) to the sonar hardware and data collection software. The R/V Parke Snavely was outfitted with three networked workstations and a navigation computer for use by the captain and survey crew for data collection and initial processing.
The surveys were completed over 24 days in 2010, from June 28 to July 21, and over 20 days in 2011, from July 6 to July 26. In 2010, over 104 km2 (40 mi2) of seafloor were mapped in water depths ranging from 15 to 105 m. In 2011, over 95 km2 (36 mi2) of seafloor were mapped in water depths ranging from 20 to 74 m.

Figure 2. Photograph of the U.S. Geological Survey R/V Parke Snavely.
Read the complete article here.
Do you have questions about this article?
Get in touch with QPS, and they would be happy to answer any questions you have about pricing, suitability, availability, specs, etc.


