


Scanning for Earthquake Consequences
Abstract:
LiDAR, which stands for Light Detection and Ranging, is a remote sensing method used to examine the surface of the Earth. It employs laser light to measure distances to the Earth’s surface, generating precise, three-dimensional information about the shape of the Earth and its surface characteristics. LiDAR technology has many applications, including topographic mapping, forestry, agriculture, urban planning, and autonomous vehicles. This article discusses using LiDAR to analyze earthquake consequences and how it complements modern technology.
The sections covered will be Introduction to LiDAR, Current Technologies for Analyzing the Effects of Earthquakes, and How LiDAR can help analyze earthquake impacts. The conclusion will summarize the benefits of using LiDAR to investigate earthquake impacts by comparing it to its counterparts.
Section 1. Introduction to LiDAR
LiDAR (Light Detection and Ranging) is a remote sensing technology that uses laser light to measure distances to objects. The main components of LiDAR include a laser, scanning system, receiver, and data processing system. The working principle of LiDAR can be described as follows:
Laser pulse emission: The LiDAR sensor generates and emits laser pulses in the direction of the area to be investigated. The frequency of the pulses can reach hundreds of thousands per second.
Scattering and reflection: The laser pulses interact with objects on the propagation path, and part of the pulse energy is reflected to the sensor.
Receiving the reflected signal: The LiDAR receiver detects the reflected signals. The time it takes for the pulse to return is recorded for each pulse.
Distance Calculation: The distance to the object is calculated based on the time t of the laser pulse traveling from the source to the object and back. The formula for calculating the distance L is based on the speed of light C:
Creating a point cloud model: Each recorded pulse correspondence to one point in three-dimensional space. The LiDAR system combines these points to create a point cloud representing the shape and position of objects in the study area.
Data processing: The resulting point cloud is processed to create detailed 3D models and maps. These models can be used for various purposes, including mapping, autonomous driving, surveying, and environmental monitoring.
The main differences between LiDAR models are the scanning angle, maximum range, return count, and accuracy. Most modern LiDARs can operate in several scanning modes. For example, the XT32 can adjust the rotation speed, scanning angle, and the number of returns, affecting the density of the point cloud and the penetration ability of lasers under trees and grass, as shown in Figure 1 [1].
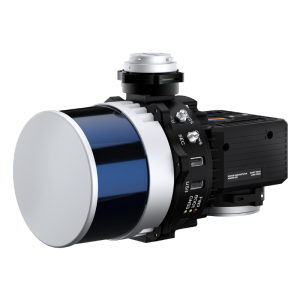
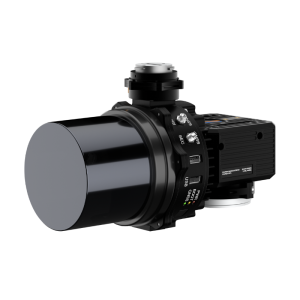
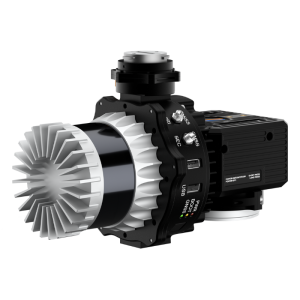
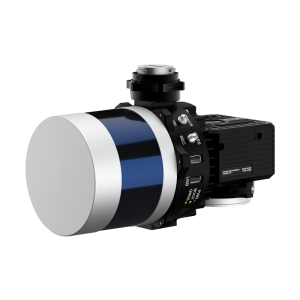
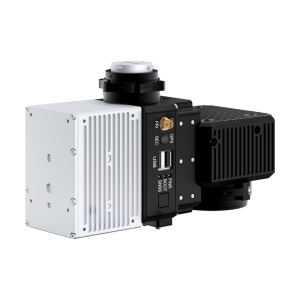
The combination of LiDAR and an inertial navigation system (INS) manufactures a new system by which each point can be georeferenced with centimeter-level precision and accuracy [2]. An example of a device that takes advantage of these is the Inertial Labs RESEPI Payload [3]. The RESEPI Payload is compact and fully customizable to fit various use cases. Users can choose configurations that include a camera, LiDAR model, and GNSS receiver. It is most used on drones and small unmanned aircraft systems (sUAS). After LiDAR payloads collect data, it’s essential to post-process the raw data before obtaining the point cloud. Inertial Labs has developed specialized software for this purpose – PCMasterPro [4]. This software is easy to use, and all operations are performed semi-automatically. The entire system is designed to make it as easy for users to work with it.
Section 2. Current Technologies for Analyzing the Effects of Earthquakes
The term “earthquake” is often used to describe any seismic event that generates seismic waves. Earthquakes can occur naturally by moving the Earth’s tectonic plates, geological faults, volcanic activity, landslides, and other seismic phenomena. Human activities like mining, hydraulic fracturing, and nuclear testing also cause earthquakes.[5]. Activities both above and below ground can change stresses and strains in the Earth’s crust, including building reservoirs, extracting resources such as coal or oil, and injecting fluids underground for waste disposal or hydraulic fracturing.
Earthquakes can cause fires due to damage to power lines or gas pipelines. If a water line breaks and there is a loss of pressure, it may also be complex to stop the fire from spreading once it has started. More deaths in the 1906 San Francisco earthquake were caused by fire than by the earthquake itself [6]. Floods can also be a secondary consequence of earthquakes if dams are damaged [7]. Earthquakes can cause landslides on rivers, which collapse and cause floods.
Therefore, it is essential to carry out work on earthquake risk management, which includes forecasting and studying earthquake consequences. This will result in seismic retrofitting of structures and seismic engineering to design structures that can withstand seismic waves.
The study of earthquake consequences impacts includes a variety of methods and approaches, including:
– Geodetic methods measure earth surface displacements and deformations, including GPS, InSAR (Interferometric synthetic aperture radar), and SAR (Synthetic aperture radar). Geodetic methods make it possible to estimate the size and nature of deformations caused by an earthquake [8, 9]. The InSAR method provides information on slow-moving landslides over large areas. PSInSAR (Persistent Scatterer Interferometry) and similar methods provide displacement accuracy down to the millimeter. They are particularly suitable for monitoring displacements after earthquakes but cannot be used to characterize rapid landslides because they have limitations such as changes in the reflection of objects or areas, atmospheric influences, and signal interference. Statistical minimization of this interference can be achieved by using radar data over a more extended period and identifying coherent radar targets – permanent scatterers (buildings and rocks). Therefore, it’s not suitable for mapping rapid landslides caused by earthquakes [10].
– Geophysical methods include seismic and gravimetric studies, which allow us to assess the Earth’s crust’s structure and the masses’ distribution after an earthquake. Various instruments are available to measure geometric, geotechnical, geophysical, and hydrological properties necessary for stability analysis of earthquake-induced landslides (seismographs, gravimeters, etc.) [11]. Point investigations provide only information at the level of object investigation, so there needs to be more access to facilities with equipment.
This is mainly fieldwork, which allows only small areas to be assessed; mapping earthquake consequences over large areas takes much time and money.
– Geological engineering studies: These methods include analyzing damage to buildings and infrastructure and studying the behavior of soils and rocks caused by earthquakes. These are mainly non-destructive testing methods, such as ultrasound, ground-penetrating radar (GPR), and rebound technology [12]. As with fieldwork, the difficulty of accessing equipment sites and large areas is time-consuming and costly [13].
– Aerial imaging: aerial photography from a helicopter/plane/drone, satellite imagery, photogrammetry. It covers large areas and can be obtained at different times to show the development of landslides. It can also be converted to stereoscopic images for optimal interpretation. It’s possible to compare images from various periods directly for definition changes. There are no additional costs for purchasing images. There are also dedicated tools for collaborative web-based landslide mapping that are now available, such as NASA Landslide Reporter [14]. The disadvantage of aerial imaging is the cost of renting a helicopter/airplane. The influence of bad weather is also vital since cloudiness can be a severe obstacle to satellite images.
Photogrammetric methods for creating digital elevation models from overlapping aerial or satellite images can accurately cover large areas. They are like LiDAR, but these methods do not provide information about the surface under tree canopies and other possible obstacles, as shown in Figure 2 [15].
Thus, there are many methods for studying the effects of earthquakes. Next is the application of LiDAR, specifically in the next section, “How can LiDAR help with analyzing earthquake consequences?”
Section 3. How can LiDAR help with analyzing earthquake consequences?
LiDAR is the fastest way to survey a damaged area because it eliminates the need for field surveys. Once the data is recorded, there is no need to revisit the survey site to obtain additional data as the point cloud model is sufficient, compared to using a photogrammetric solution. As a result, the user’s time on site is significantly reduced. In addition, the speed of retrieval and accuracy of this data helps reduce costs that would otherwise be spent on fieldwork. Typically, the recommended drone speed for a LiDAR mission is five m/s. For the XT-32, the recommended flight altitude is 50m for optimal accuracy and coverage (100x28m). Thus, it will take only 20 minutes to scan an area of 0.5 km^2. An example of a flight setup can be seen in Figure 3.
Thanks to multiple returns, information about the condition of the surface in vegetation or under trees will also be available. If it is too dense, there will be insufficient detail to determine the geometry of objects [16]. However, other scanners like the XT32-M2X can offer a much higher point density cloud and triple returns to compensate for canopy cover.
Unlike photogrammetry, LiDAR can scan at night because the emitter generates rays in the infrared range and, therefore, does not require illumination visible to the human eye. LiDAR data also provides a three-dimensional image of the area. The ability to create a detailed digital map of the area using satellite coordinates makes it possible to determine the amount of displacement of the Earth’s strata at the fault site.
It is also essential that the use of remote scanning makes the process of analyzing the earthquake consequences safer.
To date, successful applications of LiDAR for earthquake analysis exist. Some note-worthy points from other studies include:
“The 3D laser point cloud data can quickly and directly obtain products such as DSM/DEM and can obtain a large area of DEM or DSM in a short period.” [17]
“The excellent ranging accuracy of the LiDAR sensor, combined with the high-quality navigation solution, resulted in a vertical LiDAR point accuracy falling in the sub-decimeter range and can be further improved where ground control is available.” [18]
Using LiDAR data, assessing the extent of destruction and planning rescue operations is easy. It will also help scientists estimate the likelihood of future earthquakes. Thanks to the classification of point clouds, damage in the urban sector can be assessed, and a budget for the restoration of destroyed buildings can be calculated.
LiDAR payloads such as the RESEPI Payload from Inertial Labs allow users to obtain highly accurate georeferenced point clouds and color clouds through camera integration. They can also operate at night. Another benefit is more images for photogrammetry (Figure 4) [19, 20].
Using third-party software (LiDAR360, TerraScan, etc.), users can get georeferenced SLAM data, obtaining comprehensive data from ground and air scans [22, 23]. The high-precision data obtained from RESEPI makes it possible to estimate soil displacements, as shown in Figure 4. There are also features for classification and digital mapping [24].
Thanks to the implementation of SLAM technologies in Inertial Labs’ PCMasterPro software, users can scan terrain without using a GNSS signal, allowing them to receive data under the treetops, as shown in Figure 3 [21]. Data recording does not require a GNSS receiver and base station and can be done either in-flight or on foot. A convenient backpack and a handle for scanning the area were developed, displayed in Figure 5. The user can walk near places of interest and monitor them both with satellites, having received georeferencing, and in SLAM mode.
Before using RESEPI Payload, the user must have a drone and flight license, a base station (unless performing ground scans), and a PCMasterPro software license for data processing [25].
Conclusion
Many methods have been developed to analyze earthquake consequences, each with advantages and disadvantages.
Geodetic methods provide information about crustal displacements and ground conditions but are sensitive to atmospheric phenomena and signal interference. Compensating for these shortcomings requires time and money.
Geophysical methods involve fieldwork using hand-held instruments, such as seismographs and gravimeters. Like geodetic methods, they are time-consuming and expensive, especially over large areas.
Engineering geological research uses ultrasonic instruments and radars to study earthquake consequences of building and structure destruction. Aerial photography, in particular photogrammetry, does not work at night without additional lighting and does not provide complete information about the condition of the surface if tree crowns or other obstacles cover it.
Although LiDAR payloads, like Inertial Labs’ RESEPI Payload, also have disadvantages that limit their use in harsh weather, they enable users to obtain highly accurate, georeferenced color point clouds through the integration of a camera, GPS receiver, and inertial navigation system. They can also work at any time of the day. In addition, the user can access color and high-quality photographs for photogrammetry, if necessary. Thanks to third-party software, the user can use the collected information to measure ground displacements due to earthquakes accurately.
References
[1] Dutt, Namrata. “A Quick Guide to LiDAR: Part 1- Theory.” Medium, 7 Mar. 2022, medium.com/@namratadutt2/a-quick-guide-to-LiDAR-part-1-theory-7c8ff48af0b9. Accessed 4 June 2024.
[2] Wikipedia Contributors. “Inertial Navigation System.” Wikipedia, Wikimedia Foundation, 21 May 2019, en.wikipedia.org/wiki/Inertial_navigation_system.
[3] “RESEPI – LiDAR Payload & SLAM Solutions.” RESEPI, LiDARpayload.com. Accessed 3 June 2024.
[4] Inertial Labs. “RESEPI Quick-Start Guide – Setting up Your LiDAR Survey System and PCMaster – Inertial Labs.” YouTube, 4 Aug. 2022, youtu.be/AygQTBVNrKw. Accessed 3 June 2024.
[5] Foulger, Gillian R., et al. “Global Review of Human-Induced Earthquakes.” Earth-Science Reviews, vol. 178, Mar. 2018, pp. 438–514, www.sciencedirect.com/science/article/pii/S001282521730003X, https://doi.org/10.1016/j.earscirev.2017.07.008.
[6] “The Great 1906 San Francisco Earthquake.” Web.archive.org, 11 Feb. 2017, web.archive.org/web/20170211170826/earthquake.usgs.gov/regional/nca/1906/18april/index.php.
[7] “Historical Earthquakes Listing.” Web.archive.org, 16 May 2011, web.archive.org/web/20110516173115/www.quakes.bgs.ac.uk/earthquakes/historical/historical_listing.htm.
[8] Erol, S & Erol, Bihter & Ayan, Tugce. (2004). A general review of the deformation monitoring techniques and a case study: analysing deformations using GPS/levelling.
[9] Dell’Acqua, Fabio, and Paolo Gamba. “Remote Sensing and Earthquake Damage Assessment: Experiences, Limits, and Perspectives.” Proceedings of the IEEE, vol. 100, no. 10, Oct. 2012, pp. 2876–2890, https://doi.org/10.1109/jproc.2012.2196404.
[10] Ostir, Kristof, and Marko Komac. “PSInSAR and DInSAR Methodology Comparison and Their Applicability in the Field of Surface Deformations–a Case of NW Slovenia.” Geologija, vol. 50, no. 1, 30 June 2007, pp. 77–96, https://doi.org/10.5474/geologija.2007.007. Accessed 23 Dec. 2022.
[11] “CLU-in | Technologies > Characterization and Monitoring > about Characterization and Monitoring Technologies > Geophysical Methods > Overview.” Clu-In.org, clu-in.org/characterization/technologies/default2.focus/sec/Geophysical_Methods/cat/Overview/.
[12] Wikipedia Contributors. “Nondestructive Testing.” Wikipedia, Wikimedia Foundation, 18 Aug. 2019, en.wikipedia.org/wiki/Nondestructive_testing.
[13] “Post-Earthquake Assessments with Non-Destructive Testing.” Www.screeningeagle.com, www.screeningeagle.com/en/inspection/post-earthquake-assessments-with-ndt#:~:text=NDT%20techniques%20commonly%20used%20for. Accessed 4 June 2024.
[14] “Landslide Reporter – NASA Science.” Science.nasa.gov, science.nasa.gov/citizen-science/landslide-reporter/. Accessed 4 June 2024.
[15] “Forests.” Www.mdpi.com, www.mdpi.com/1999-4907/4/4/. Accessed 4 June 2024.
[16] “Multiple return LiDAR” Iitk.ac.in, 2024, home.iitk.ac.in/~blohani/LiDAR_Tutorial/Multiple%20return%20LiDAR.htm. Accessed 3 June 2024.
[17] He, G., and A. Wang. “STUDY on the APPLICATION of AIRBORNE LIDAR in SEISMIC ACTIVE FAULTS in the NORTHERN RIM of QINLING MOUNTAIN and the PIEDMONT of HUASHAN in CHINA.” The International Archives of the Photogrammetry, Remote Sensing and Spatial Information Sciences, vol. XLIII-B2-2020, 12 Aug. 2020, pp. 241–246, isprs-archives.copernicus.org/articles/XLIII-B2-2020/241/2020/isprs-archives-XLIII-B2-2020-241-2020.pdf, https://doi.org/10.5194/isprs-archives-xliii-b2-2020-241-2020.
[18] Toth, Charles, et al. LIDAR MAPPING SUPPORTING EARTHQUAKE RESEARCH of the SAN ANDREAS FAULT. 2007.
[19] “Surveying Earthquake Damage with LiDAR in Papua New Guinea.” Global Unmanned Systems, 1 Sept. 2018, www.gus-uav.com/news/2019/1/7/surveying-earthquake-damage-with-LiDAR-in-papua-new-guinea. Accessed 4 June 2024.
[20] “RESEPI – LiDAR Payload & SLAM Solutions.” RESEPI, LiDARpayload.com. Accessed 3 June 2024.
[21] Wikipedia Contributors. “Simultaneous Localization and Mapping.” Wikipedia, Wikimedia Foundation, 8 July 2019, en.wikipedia.org/wiki/Simultaneous_localization_and_mapping.
[22] “LiDAR360 Software and Real-Time Point Cloud Display.” Www.greenvalleyintl.com, www.greenvalleyintl.com/LiDAR360/.
[23] “Terrasolid – Software for Point Cloud and Image Processing.” Terrasolid, 21 Sept. 2023, terrasolid.com/.
[24] Wikipedia Contributors. “Digital Elevation Model.” Wikipedia, Wikimedia Foundation, 16 Mar. 2019, en.wikipedia.org/wiki/Digital_elevation_model.
[25] “Buy Reach RS2+ | Buy Multi-Band RTK GNSS Receiver.” Emlid Store US, store.emlid.com/products/reach-rs2-plus?variant=47253689467185. Accessed 3 June 2024.
Do you have questions about this article?
Get in touch with Inertial Labs, Inc., and they would be happy to answer any questions you have about pricing, suitability, availability, specs, etc.


