Nautical Bottom Mapping With a Sub-bottom Profiler
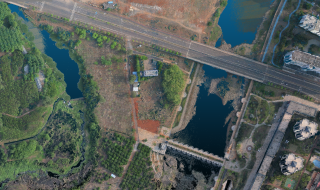
The setting is a natural harbour and river estuary. The river and estuary are too shallow for large container ships to pass during low tide. The waterway and the berth pockets along the river are being dredged regularly. One of the techniques used in this area is Water Injection Dredging. During this process water is injected under low pressure in the muddy bottom. This mix of water and sediment forms a turbidity current flowing down the slope or is transported by the tide.
Deeper parts of the river and berth pockets had been filled with this suspension of mud. Even a month after the water injection, mud clouds were present, that had not been removed by the tide or current or were subject to sedimentation. With standard surveying techniques the top of the suspension is observed instead of the actual bottom of the river. This observed level appeared above the contractual depths set by the Port Authority. Question arose whether the actual nautical depth is deeper than the observed depth or the contractual depth can be reached in the future due to possible settlement and or consolidation.
To investigate this layer of suspended material (silt, mud) several density measurements were executed to observe the magnitude and parameters density and yield strength.
Data acquisition
47 measurements were deployed along the access channel from the port towards the sea over approximately 7 km during two sessions on two days. Thirteen were located in several berth pockets, 32 in the river and a further 2 in a shallow, none dredged part of the bay.
The contact ‘water–suspension’ was also observed by the echo sounding and during a RheoTune measurement, this depth was checked. If the top of fluid mud observed by the Rheotune deviates (more than 10 cm) from depth recorded by the echo sounder, the pressure sensor of the RheoTune, responsible for the depth-data of the probe, was cleaned and the measurement redone at the same location.
Results
Two graphs for every location were made: A density graph and a yield strength graph (both vs. depth). Besides those graphs a table is made with the locations in coordinates, the different levels were a criterion is reached.
The RheoTune profiles show clearly a low density layer above the solid bottom. In the berth pockets (graph 1) the density and yield strength gradually increase. In the channel (graph 2) the yield strength and density show both an abrupt transition. Density at the top, yieldstrength at the bottom.
Example of RheoTune profiles
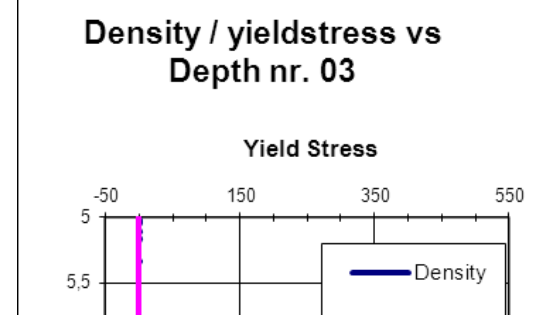
| On the right the density and yield strength profile of measurement nr. 3 are plotted. This measurement was performed in a berth pocket. The density increases immediately to 1100 g/l inside the mud layer. A second sudden increase in density is visible at 9.5 m depth, indicating a multi layered suspension. The yield strength increases more gradual in the top part of the mud and more rapidly in the second layer of mud. |
 |
 |
On the left the density and yield strength profile of measurement nr. 28 are plotted. This measurement was taken in the middle of the river. The density increases immediately to 1170 g/l inside the mud layer and stays more or less the same for the entire layer. The yield strength does not increase at all in the first 80 cm of the mud layer and increases rapidly at the bottom the suspension. |
| On the right the density and yield strength profile of measurement nr. 3 are plotted. This measurement was performed in a berth pocket. The density increases immediately to 1100 g/l inside the mud layer. A second sudden increase in density is visible at 9.5 m depth, indicating a multi layered suspension. The yield strength increases more gradual in the top part of the mud and more rapidly in the second layer of mud. |
|
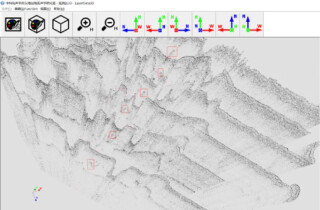
Channel section

Cross section along the river from the city (at Kp 0) to 7 km downstream. The top of the mud layer is plotted in blue, the nautical depth, with use of the 30 Pa criterion, is drawn in pink. The areawith fluid mud in between is shaded. The design depth is plotted in black (5.7 meter for the first 3000 meter, 7 meter for distal channel).
Interpretation
Channel
In the deeper part of the channel a fluid mud layer is present. The RheoTune measurements indicate that the solid bottom is deeper or at the design depth in all measurements. As treshhold, the fluid-solid criteria, the yield strength of 30 Pa has been adopted. When analysing the vertical profile the density of the mud increases at the top to appr 1150 gr/l and gradually increases to 1200 gr/l and higher. In the lower section the density is over a about 0.5 meter around 1200 gr/l. A small error in density may therefor result in a significant change in depth of the nautical depth when the criteria of density equals 1200 gr/l is adopted. The 30 Pa criteria is practically identical to the 1200 gr/l but clearly defines the start of a transition from pure fluid (0 Pa) to solid >100 Pa.
Berth pockets
The density and yieldstrength in the berthpockets gradually increase with depth. The profile is clearly differing from the channel. The dynamic channel area prevents the fluid mud from settling and consolidation. In the berth pockets the low dynamic conditions result in slowly normal consolidation of the mud. Simultaneously with the density increase the yield strength increase. Mud of 1100 g/l already shows yield strength and semi solid behaviour. This is due to the ability of mud and silt particles to form bonds. These particle bonds result in more solid behaviour than would be expected from density alone. In the tidal berth pockets a yield strength of 350 Pa can be adopted as a criteria. Likewise the 1200 g/l level will be a practical measure. All material below 0.5 kPa will not have significant impact on the vessel hull in static condition as this material will flow easily aside.

Related products

![3月21日-封面[1].jpg](https://cdn.geo-matching.com/voeE1ywo.jpg?w=320&s=6b3b1a0215d770f8797653e9202a8f52)


