Drone Surveying in High-wind Conditions
As UAV Surveying becomes more popular, surveyors want to get ever-more use out of their drones in everyday situations. In certain locations, especially those in alpine or coastal environments, this means surveying in high-wind conditions. It is common practice for UAV manufacturers to claim high wind tolerances, but how does this play out in real life?
Drone Surveying in High-wind Conditions
As UAV Surveying becomes more popular, surveyors want to get ever-more use out of their drones in everyday situations. In certain locations, especially those in alpine or coastal environments, this means surveying in high-wind conditions. It is common practice for UAV manufacturers to claim high wind tolerances, but how does this play out in real-life?
The specified wind limit of Marlyn is 45km/h for take-off and landing in helicopter mode, and 55km/h for the actual mapping mission in airplane mode. To demonstrate this in a real-world setting, this document will describe a survey which was carried out in the wind conditions near the limits that are recommended to Marlyn users. This serves to provide both evidence that Marlyn can fly at these high wind speeds, and to show the minimal effect this has on the survey data, thus showing its applicability as an everyday survey tool.
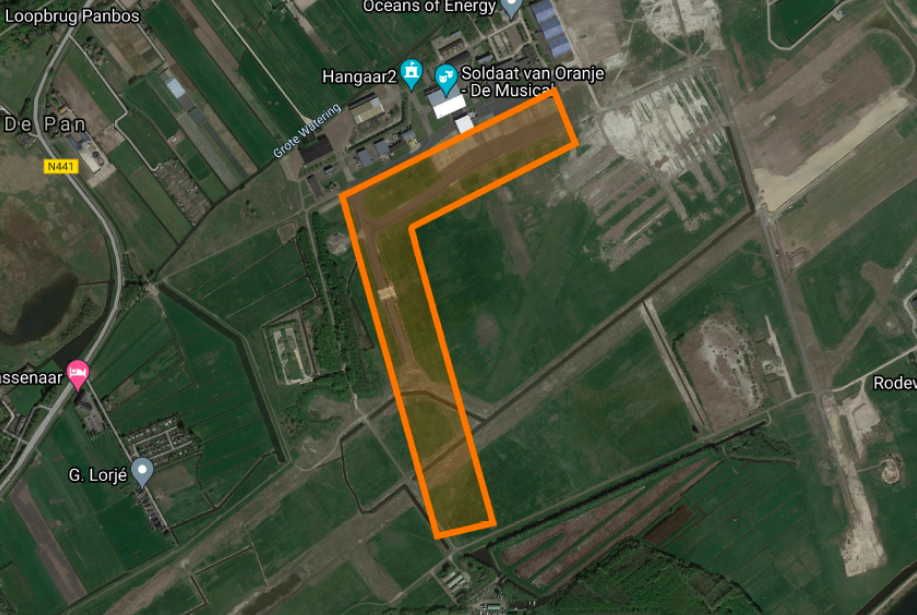
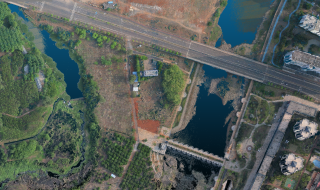
Introduction to the Survey Area
This flight was conducted on 27th October 2020 at Atmos’ Headquarters and test field in Valkenburg, the Netherlands, the location of which is shown below.
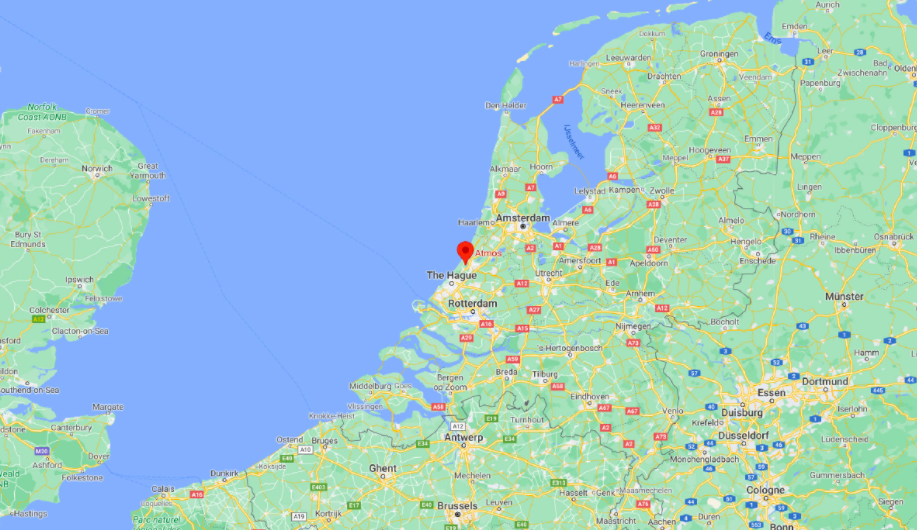
Atmos HQ and Flight Area Location
Until 2006,this site was used by the Royal Netherlands Navy as an airbase for their fleet of 13 Lockheed P-3 Orion Aircraft. Valkenburg’s coastal location made it the ideal place during the Cold War for the P-3’s to hunt for Soviet submarines operating in the North Sea and English Channel, and today, it is used as an open airspace for drone companies to test and develop their products.
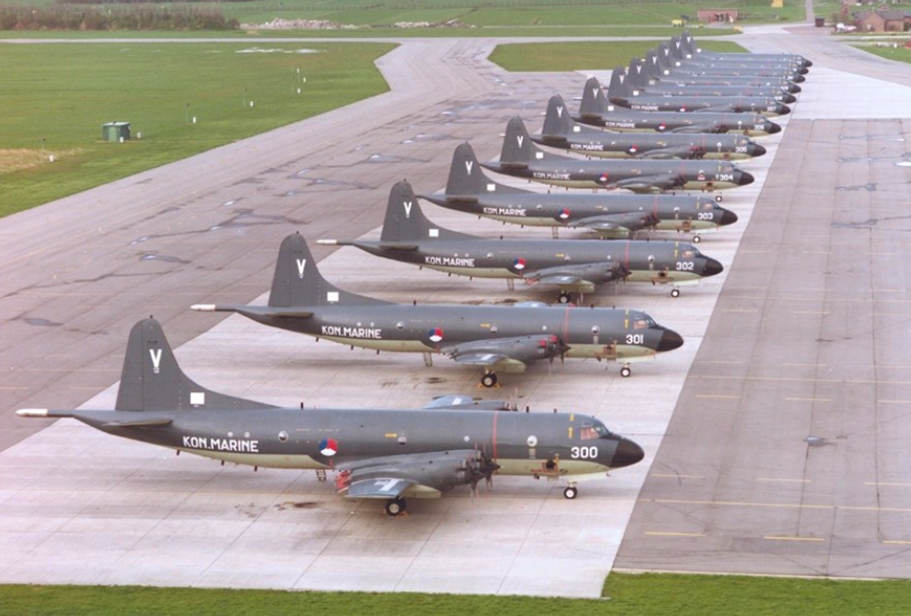
Netherlands Navy Orions at Valkenburg. The current Atmos HQ is just out of shot
Valkenburg’s location only 3km from the coast also makes it ideal for testing a drone in high wind conditions. For roughly two-thirds (227 days) of the year, the cold North Sea wind is gusting above 30 km/h (according to wind data from visual crossing).
Since 2013, every drone which has left the factory of Atmos has undergone pre-dispatch testing at this location. So in order to be able to test, produce, and ship drones effectively, Marlyn must be capable of tolerating high winds in each mapping mission without significant degradation in survey performance.
The Survey Task
The data gathered in this project was a standard survey rendered as part of a pre-delivery inspection flight test, in which a mapping mission is performed to ensure that the drone is guaranteed to perform accurate surveys straight out of the box. Only if the result of this survey is within the required quality standard can the system be shipped out, in this specific case for a customer in Thailand.
For this specific mission, the survey task was determined as taking a Digital Terrain Model of the former taxi track and flight line shown in the above image. Included in the survey area were several known points which were to act as control points & check points to verify the absolute accuracy of the model. The flight was to be conducted at 110m of altitude, resulting in a Ground Sampling Distance (GSD) of 1.45cm/px. The total survey area was 21Ha.
Therefore, the survey task was a simple, small area which it can be assumed replicates an every day survey which is undertaken by a user in the field.
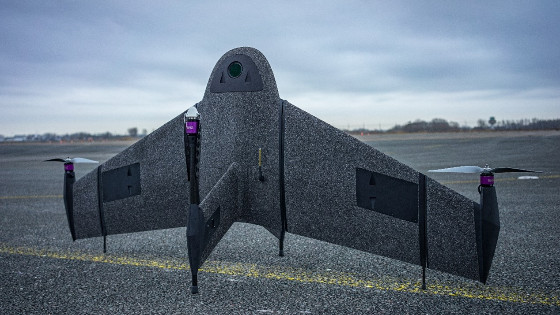
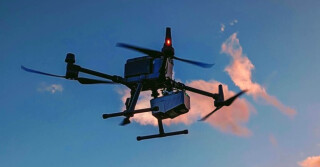
The Drone
The drone used for this test was the Marlyn from Atmos. The Marlyn being used for this test was equipped with the Sony RX1RII 42MP RGB camera, with the Septentrio AsteRx-m2 PPK module installed.
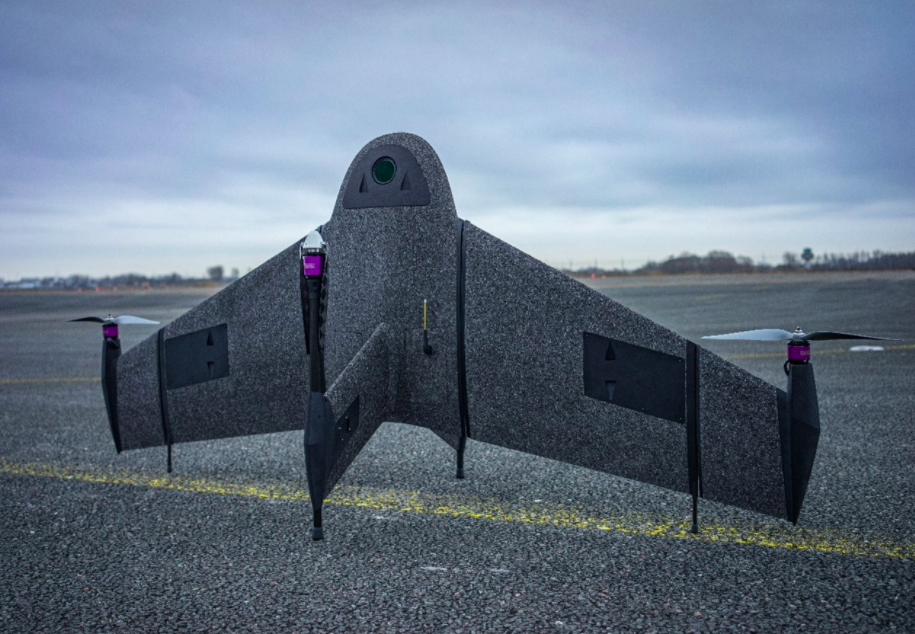
Marlyn with Sony RX1RII Camera
Wind Forecast
As shown in the image below, the wind forecast at the flight location on the day was shown as a light blue colour, which the legend indicates as 25knots (45km/h or 12.5m/s).This forecast also shows only the averaged sustained wind speed, so it can also be assumed from experience that the localised wind gusts will exceed 55km/h (15m/s) for short portions of the flight.
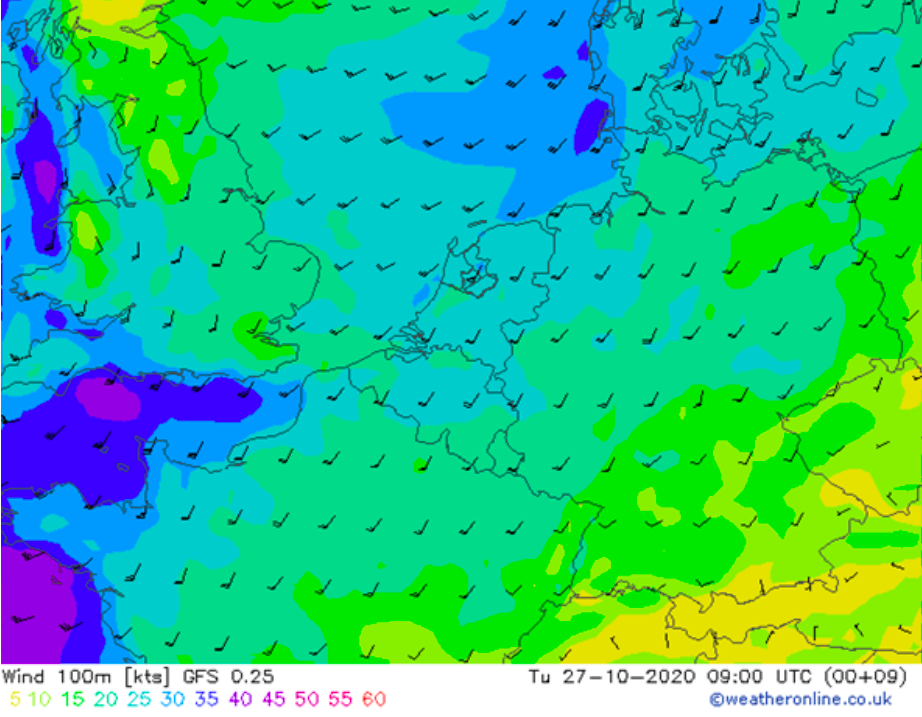
Weather forecast for the flight in question (in knots)
Therefore on this particular day, the wind forecast at 100m above ground level showed wind gusts up to and exceeding the 45km/h limit of the drone. As Marlyn had demonstrated multiple times in the past that it is capable of safely operating in these conditions, the decision was taken to perform the flight despite that the winds being on/over the edge of what Marlyn was designed to handle.
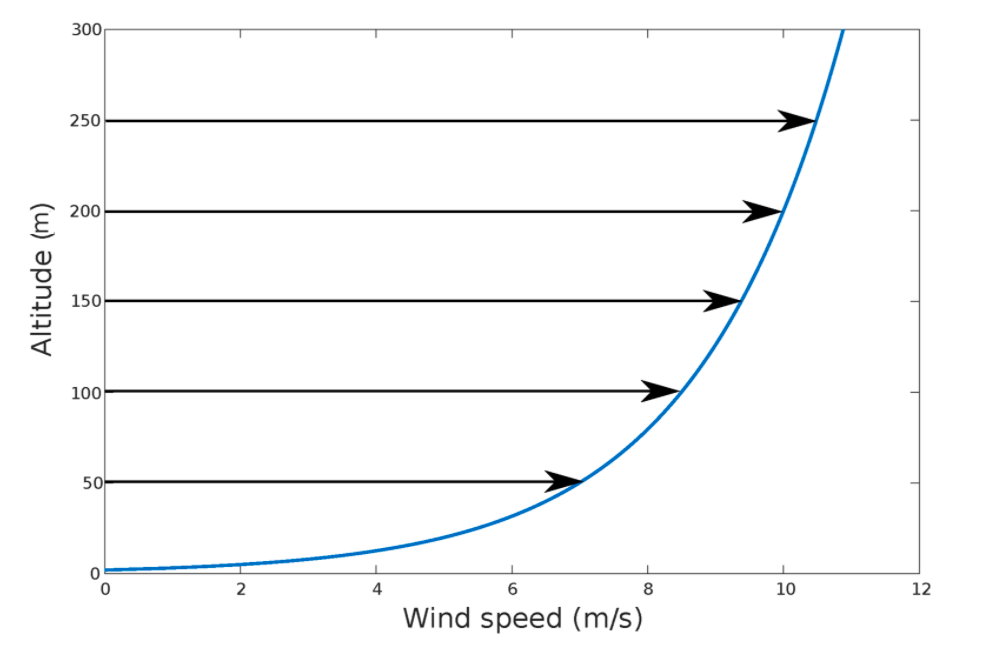
Demonstration of how wind speed changes according to altitude
When planning a UAV flight it is wise to work with aviation forecasts at 100m rather than normal ground level forecasts, due to the differences in strength and sometimes even direction of the wind between those two altitudes. At ground level, the wind is inside what is known as a ‘boundary layer’, meaning that friction with objects such as terrain, buildings, and trees, cause the wind speed to be lower than the drone experiences in flight. Therefore, the further away from the ground, the less of an effect this friction will have, and the higher the wind speed. A visual example of this is shown above.
What does this mean for a drone? Depending on local conditions, the wind speed at Marlyn’s helicopter mode altitude can be as much as double the wind speed at ground level.
To relate this back to our forecast, although the base wind speed at altitude was 45km/h, the reading on the ground was somewhat lower, around 35km/h. This highlights the importance of always checking the correct forecast, and the importance of having a drone that can withstand higher wind limits if circumstances change.
The Drone Surveying Flight
Atmos' Navigator
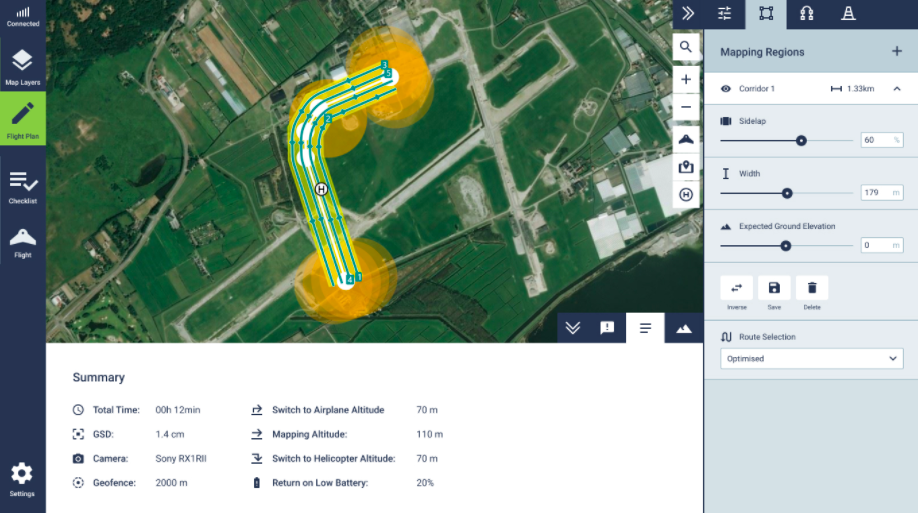
The flight in question was a simple corridor map to allow Marlyn to cover the survey area. It may be of interest to the reader to note that Marlyn uses enhanced corridor mapping, meaning that during a 90-degree turn like the one shown here, the drone is programmed to still take photos and retain the specified frontal and side overlap, thus preventing time from being wasted by circling and re-entering the second part of the corridor.
The survey parameters used a mapping altitude of 110m, VTOL transition altitudes of 70m, and a side overlap of 60%. The frontal overlap in this survey was pre-set using a 1Hz time interval for image capture with the drone’s speed being regulated to maintain a minimum 70% frontal overlap. In Marlyn’s software, the user is given the option of this time-based image capture or a position based image capture where the frontal overlap percentage can be adjusted by the user pre-flight.
Shown above is also an indication of the wind direction, typically the best results in high winds are attained when the wind is at approximately 45 degrees to the flight lines, which is close to the situation for the large part of the flight in this case.
The flight was also planned with a 20% Return to Home battery safety setting, but due to the relatively short (10min) length of the flight it was well within Marlyn’s possible flight time so would not be required.
In-flight
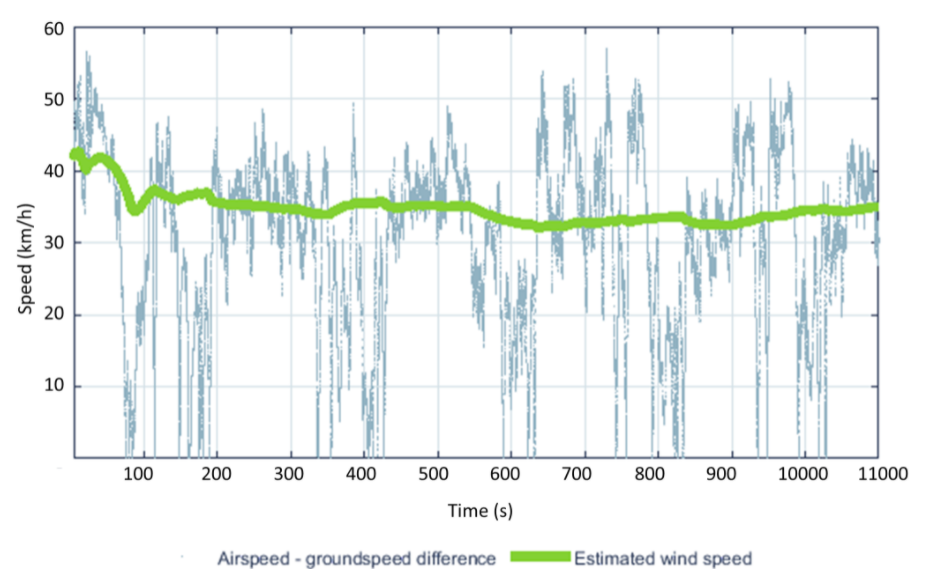
Shown below is an extract of the autopilot data during the mapping flight. The lines in dark blue show the difference between airspeed (the speed which the drone ‘sees’ through its pitot tube measurements), and the ground speed (the actual distance that Marlyn is covering on the ground, determined by GPS). For example, to understand this difference, a drone sitting in a working wind tunnel with a 20km/h flow will have an airspeed of 20km/h, but a ground speed of 0km/h. Therefore, by subtracting the airspeed and ground speed, a very accurate real-time picture can be generated of the wind speed, especially for those portions of the flight where the drone is flying into the wind. By averaging out these values, Marlyn also generates an estimate of the average wind speed, shown below as a thick light green line, although the maximum gusts experienced in flight were much stronger.
Data from Marlyn's Autopilot showing wind speeds
The dark blue airspeed-groundspeed plot shows a large variety of peaks and troughs during the flight, which comes from the different parts of the survey in which the drone is pointed upwind or downwind. Of the most significant are the peaks of this plot, which show the maximum wind gust speeds which are encountered during the parts of the flight where Marlyn is flying against the wind because these are the points at which you get an indication of the true wind speed.
This plot shows that during the flight Marlyn experienced wind gusts of up to 57km/hr, multiple instances of up to 50km/h, and an average sustained wind speed of 35-45km/h. Therefore, it can be assumed that the flight information and the data shown represents the high wind values that are included in Marlyn’s specification.
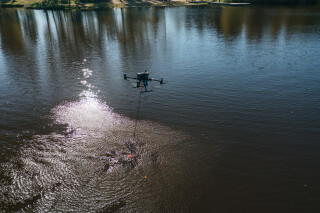
Landing
Landing is the prime concern when operating a fixed-wing in high winds, as this is the part of the flight in which complete control is the most necessary, and also the most difficult to attain. As such, after Marlyn descends to 20m of altitude above the ground, the remaining part of the landing is performed manually by the user with Marlyn’s RC (in a similar fashion to a multirotor drone). The video of the landing from this exact flight can be found below.
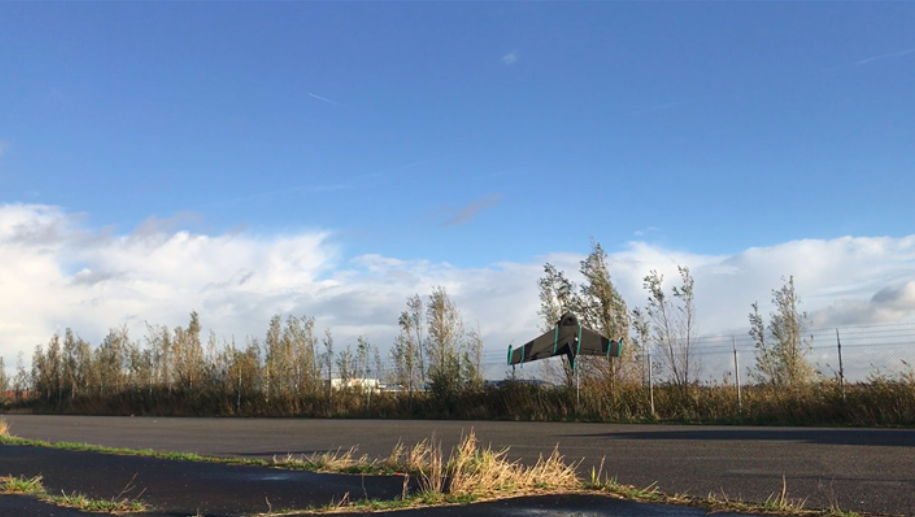
Marlyn's landing following the mapping flight
To allow for complete control in high winds, Marlyn has quad-rotor control in the helicopter mode, which provides full control in all 6 degrees of freedom, with rotating wingtips to provide small adjustments to pitch, roll, and yaw in real-time. When landing a VTOL drone it is extremely important to land with vertical speed only (ie. no horizontal motion), therefore this level of control is very important for high wind operations. Marlyn is also designed to lean into the wind at an angle of 40 degrees or more so that when the first landing leg hits the ground, the motors reduce power and the force of the weight of the drone forces it to land on its stable cross-shaped base. This makes the bouncing and tipping behaviour experienced with other VTOL’s a highly unlikely occurrence, even at winds far in excess of the 30kph maximum which is restricted by those products.
Post-Processing (drone survey data)
After the flight, the results were PPK processed using the Atmos Geotagger software. To further account for any deviations due to the wind, the orientation angles of the drone at each timestamp were also extracted for use in the photogrammetry step. This resulted in a set of images and geotags which were then processed using Agisoft Metashape, the coordinate system used was Amersfoort / RD New (EPSG::28992). For the RINEX data, a VRS(Virtual Reference Station) was sourced from 06-GPS, a Dutch provider of GNSS data.
The quality report for this processing job can be downloaded here, but will also be summarised below. To download the geotagged image set for your own processing, you can also click here.
Survey Results
To maintain usability, it is not sufficient to simply be able to fly in the wind, the survey results must be indistinguishable from those obtained on a non-windy day, whilst also maintaining a survey-grade accuracy.
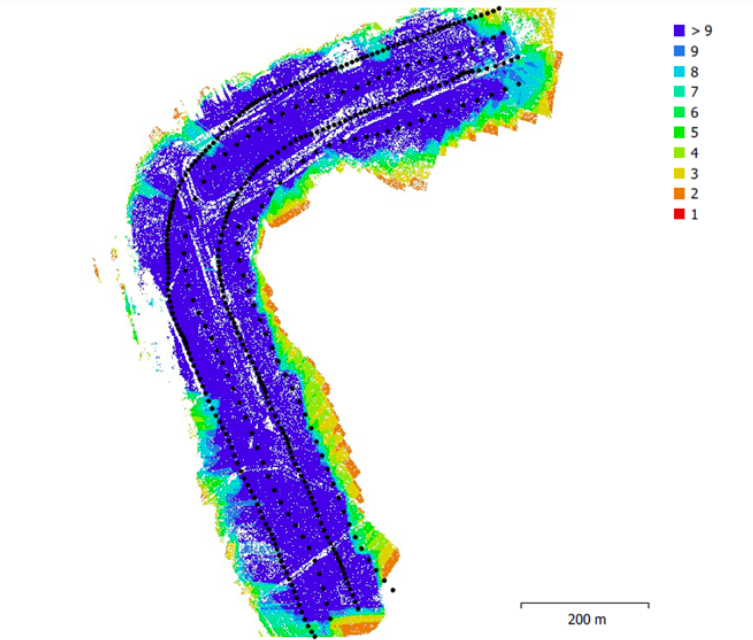
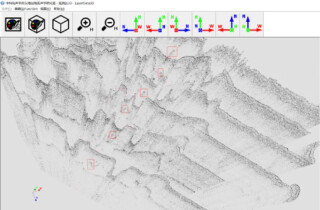
Image locations and number of overlapping images
Firstly considering the image overlap level. It can be seen from the above output that throughout the survey area, the required image overlap was still well within the required levels (9 images or more) for an accurate survey. This resulted in a model of 526,208 tie points over the 23.6Ha area.
This is of particular interest due to the high winds. If a fixed-wing drone has only a single aeroplane mode propeller, the drone must ‘lean’ sideways into the wind to counteract the force of a crosswind and stay on the flight line, which has a negative effect on the overlap that can be achieved. Marlyn ‘crabs’ along a flight line, and having 2 flight motors means that it can correct its course to stay on the flight line whilst retaining nadir imagery with the ground, resulting in the high overlap between pictures seen above. Also, this results in an extremely stable flight path throughout the mission as is shown by the image locations path.
Also of note is the enhanced corridor mapping in action. You can see that the flight path of Marlyn slightly cuts the corner in the corridor, meaning that during the turn the required overlap levels are still maintained and that the images still cover the required survey area.
So strictly looking at the flight lines and the overlap level, it can be postulated that it would be difficult to distinguish this high-wind dataset from one which has been performed on a calmer day.
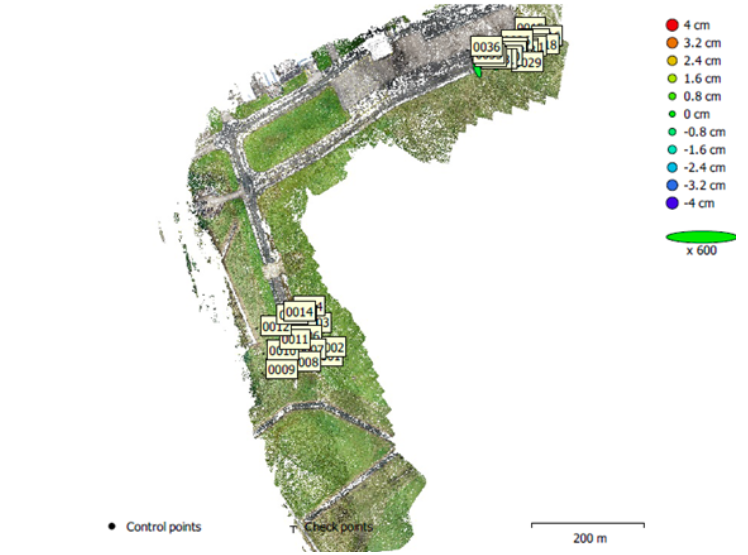
GCP locations
For this project, a total of 11 known points were used to both strengthen the quality of the model and to verify the absolute accuracy. These were split between 6 ground control points and 5 checkpoints. The resulting errors from each checkpoint are shown below;
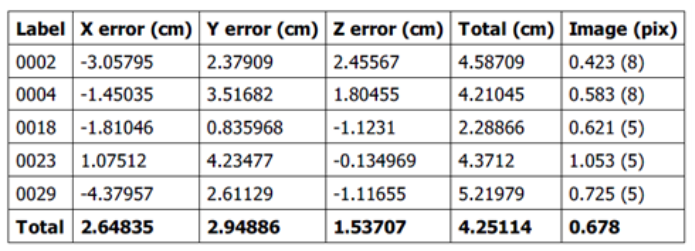
Absolute Accuracy Levels
As is shown from the checkpoints, the absolute accuracy levels are satisfactory for a UAV survey mission. As a general rule of thumb, absolute accuracies from a UAV survey are typically 2-3 times the GSD in the horizontal (X, Y) and up to 5 times the GSD in vertical (Z). The X and Y errors, in this case, are within 2x the 1.45cm GSD, and the Z errors are even close to 1x the GSD level, which is impressive considering the survey area itself was mostly a flat tarmac area without many major features from which to establish accurate tie points.
From these results, it can therefore also be concluded that the accuracy levels which one can obtain from a high wind survey are nearly indistinguishable from those which are obtained on a calmer day, and are also within what is considered a high-grade accuracy for a UAV survey.
Conclusion
The specified wind limit of Marlyn is 45km/h in helicopter mode and 55km/h in aeroplane mode. What this example shows us that it is indeed possible for a surveyor to comfortably fly with Marlyn at these high wind speeds, and also obtain data with a very high degree of accuracy.
It should be noted that extra considerations are always required when flying in high winds, and even with Marlyn users must be conservative and vigilant in ensuring that the wind levels remain within the drone’s specification. However, the data nonetheless shows Marlyn’s usefulness and applicability as an everyday survey tool in windy (and non-windy) environments.
From these results, it can therefore also be concluded that the accuracy levels which one can obtain from a high wind survey are nearly indistinguishable from those which are obtained on a calmer day, and are also within what is considered a high-grade accuracy for a UAV survey.
Downloads
Do you have questions about this case study?
Get in touch with Atmos, and they would be happy to answer any questions you have about pricing, suitability, availability, specs, etc.

Related products

![3月21日-封面[1].jpg](https://cdn.geo-matching.com/voeE1ywo.jpg?w=320&s=6b3b1a0215d770f8797653e9202a8f52)
