

Using Laser Points to Map A Zoo
Woodland Park Zoo is bringing 120 years of infrastructure and gardens into a single set of maps, thanks to a “laser mapping with Collector for ArcGIS” solution from Eos, Esri and Laser Technology, Inc. Click play to dive into infrastructure management at the WPZ. Watch the video case study: Woodland Park Zoo Laser Mapping with Polygons, Lines, and Points, Oh My!
''Thank you for inviting me up here, thanks to the folks at Eos, who helped me get to where I am with this project. You’ll see that I use a lot of their products, and I also have an article written about my work in the latest ArcNews newsletter this summer. I have a bunch of glossies up here, copies of the articles, so I can hand those out to anyone who’s interested.''
My name is Dann Block, I am the lead gardener at Woodland Park Zoo located in Seattle, Washington. A bit about the zoo; it was founded in 1899, and it’s 120 years old. We get about 1.3 million guests per year. It is 92 acres sitting on top of a hill. I’ve got a great image coming up, an aerial, that will kind of show you the landscape. There’s a long history of Woodland Park Zoo. It started out as mainly a public park with some zoo exhibits, and it’s evolved into the zoo today. The land has changed quite a bit and so has the zoo and its intent and its mission, which I’ll talk about today when we talk about the physical changes located at the zoo.
Another important piece of information is the property itself is owned by the city of Seattle and used to be run by the city. So, we do have some maps and information from back then when it was run in the mid-90s and switched over to the Woodland Park Zoological Society, which is a non-profit organization. During those 120 years of evolution, the exhibits have changed constantly. In the 70s the whole zoo was pretty much remodelled. They go for a naturalistic setting for the exhibits to give you an immersive experience into the biome that they’re trying to represent at the exhibits. Of course, this causes infrastructure adjustments; they pretty much restructure the whole area when they come into these exhibits, and they also find the existing underground infrastructure that gets changed and rerouted.
There had been no central GIS at the zoo before I started working there and started this project. But we do have dispersed records and CAD drawings, many of which are from surveys when the exhibits went in. A lot of the rest of the CAD drawings, they just took aerial imagery and just drew over that. So, the surveys are really accurate — the other parts, not so much. And then we just got piles of paper maps, hand-drawn maps, old architectural drafts from the twenties and thirties; which are fun to look through but really hard to piece together when you try and figure out where your irrigation shut-off valve is for the break that we have on the side of the zoo.
Also, we’re constantly doing work in the zoo. The gardener’s work; putting irrigation, fixing things, digging holes. Our exhibits crew is doing the same thing. And I think in the three years I’ve worked there, we’ve found two gas lines that we found by breaking them. So, it can be a little challenging working in that situation.
My project was essentially to build a base map of the zoo that captured the past, our present and will grow with us in the future. And some of the big challenges we have with that is our tree canopy. It is a 120-year-old park; we have some very large, mature trees, and that presents a challenge for accuracy finding our satellites. Also, we’ve got a lot of exotic animals. Many are dangerous to be around, so just getting into those areas and collecting data is a big challenge.
When I started back in 2016, the zoo had hired a grad student to do a tree inventory. The grad student started in 2015 and ended in 2016; he used University of Washington GPS equipment (it was Trimble, I believe) and collected over 3002 points with no related tree data along with that.
When he handed that off to us, our project manager had ArcMap and he also had CAD drawing software. So, we put the trees onto that map, mainly the CAD drawings, and found that some of the trees were in the middle of buildings, or in the middle of pathways. Or, when we put it on aerial imagery we see that the tree centre was outside of the canopy of that tree. So, we had some challenges from the get-go.
I started digging into this. I had a little bit of GIS background — I worked for AmeriCorps doing a watershed restoration. So, I got myself a non-profit license, which gave me ArcMap and ArcGIS Online. I took some of the Esri online training courses from their website. I don’t know if any of you are familiar with Seattle traffic — it’s terrible. So, what I usually do is come into work early to beat the traffic, and then do my paperwork in the morning. So I started working on these modules in the morning. The last one I did was a 24-hour long module, so I just did it in chunks.
It was pretty helpful, it got me going with the software, but when I started actually working with the data, trying to figure out projections and all these other things, I realized I was kind of out of my league. So, I took some classes with King County GIS Department; they hosted a couple of classes from a group called TeachMeGIS.com. It was about seven days of intensive 8-hour training on basic, advanced, and database management, all with ArcGIS.
And so, through the whole time, I was looking at forums, trying to find solutions to be able to work this data, and I came across YouTube videos from Brian Morgan with the Alliance for Public Gardens GIS. And he, with his group, created a public gardens data model.
Here’s a good view from one of my areas of where I garden in the zoo, That building right there is the Taper Viewpoint, and you can see we’ve got timber bamboo that’s 20, 30 feet tall. Just to the right here is a large red oak, and just surrounding that is a lot of large trees. The canopy, it’s beautiful because you can see a lot of distance through this canopy, but it does block satellite coverage when you’re in the middle of that. So, that was more of our biggest challenge.
So real quick; the ArcGIS for Public and Garden data model. I originally found this on the Alliance for Public Gardens GIS website, and then I found out that Esri had taken it over and upgraded it to the 2.0 model, which is what I currently use. Just for you guys’ information if you want to look into this, The Alliance for Public Gardens GIS group has taken it back to manage it. Last time I looked they only had the 1.4 Beta version up on their website, which is kind of a dialled down version of the 2.0. But I’ll be able to contact Brian Morgan and he sent me a copy of the 2.0 to share with some of the interns who are looking to do some work at the zoo.
But it’s great, it’s got all of these feature data sets that pretty much give you the full geodatabase to populate a map for use in public gardens, which it’s geared towards. Everybody should check it out, it’s a really great product.
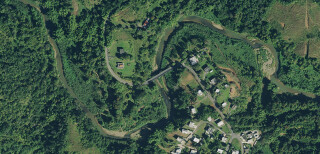
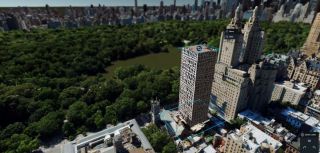
Here’s a really good aerial view of Woodland Park Zoo. You can see here this rectangle — that’s the zoo. It’s in the middle of an urban environment, downtown Seattle is above, and you might be able to see the Space Needle right there as well. Again, the biggest challenge is GPS accuracy and seeing those satellites. When I first started going out in the field to try to work on this tree data, I put the Collector for ArcGIS app on my phone and the accuracy was terrible. I couldn’t really tell which tree I was looking at based on the app itself, so we knew we had to get a better antenna.
Also, as I said, the animals in their exhibits. We try not to disrupt them as much as possible. We can work with the keepers to schedule time in those exhibits, but it’s difficult. Depending on the day and the animals’ temperament, sometimes you just have to plan weeks and weeks in advance and hope you get one date. Also, we are a nonprofit, so the budget is a huge consideration.
So, some of the solutions we came up with, is obviously I knew we wanted to use the Collector app to do our fieldwork. We already had the license. The great thing is what you do in the field, you can submit right to ArcGIS Online and then go into the office, download that into ArcMap and do whatever heavy editing you want to do. Instead of using my own personal phone, the zoo helped me acquire an iPhone 8, which is kind of a large-ish phone and fits in your pocket, which was important to me. I wanted to be able to stuff everything in my pocket to walk through the bushes or navigate some of the landscape that we have. And it also worked really well with the Esri products and also the Eos products.
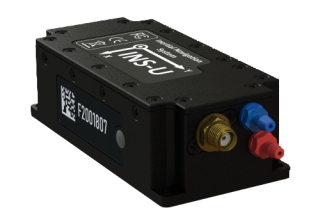
Actually, we got pretty lucky picking the iPhone, because everything kind of worked out with all the pieces of technology we pieced together for this. I did a little research; I knew we had to get an antenna. We ended up picking the Arrow 100 GNSS Receiver. It’s a submeter antenna, we knew we didn’t need centimetre accuracy, it also fits in our budget really well.
We also didn’t want to have something we had to pay a subscription for, so this fit really well for that. The budget we had was pretty much a one-time part of the major maintenance money, so we knew once we bought this thing this was pretty much all we were going to get.
And then the research that I did, we’re looking mainly at tree canopy cover. So being around large buildings and things like that, the Arrow 100 had good reviews on being able to get accuracy and precision under a dense tree canopy.
When I first started this project there was no laser offset technology that could pair with the devices that I had. Luckily, I spoke with Eos and they came up with a solution to work with the [LTI] TruPulse 200x, which works with the iPhone products. So, I was able to find a solution for laser offsets, which was really important for getting this project going. I was kind of stuck in some of our areas of dense canopy cover, I wasn’t getting good location data, even with the Arrow 100.
And the greatest thing about that too is I can take location points in the animal exhibits or on the edges of moats, which I was really nervous about with all this expensive equipment, dropping it into the moat. Especially, you can think, we have primates by these moats — the water gets kind of nasty.
And then we also purchased the TruPulse Foliage Finder lens. This thing is awesome because it’s a lens you put onto the Laser Rangefinder and it only receives signals back on reflectors. So, all the foliage, the leaves, the sticks that were kind of being blown in front of my range finding would always throw off my shot, so I was spending a lot of time trying to find that sweet spot in between the bushes. With this Foliage Finder lens, I got my reflector, I can tie it off on a tree right above the irrigation box I want to capture, and I can be 30 feet away and capture that. And we use range-range offsets with the Eos Tools Pro App that came with the antennae.
So, here’s our final base map solution. Again, you saw Collector for ArcGIS, iPhone8, Arrow 100 TruPulse 200x Laser Rangefinder, FoliageFinder lens, the ArcGIS Parks and Gardens Data Model, and also we purchased the ADIR Pro 5m telescoping survey pole, which I find helps quite a bit in getting that antennae up above fences, buildings, up above the foliage canopy just a little bit better. I’m pretty happy about that. We put a bipod on it so I can actually set it up, stand back, do my work, and not worry too much about it tipping over.
Here’s a view of pretty much where we are currently at with the base map. My area is right here, and you can see I’ve done the most work. What I do is I go out and I capture a polygon at the edges of the garden beds, and then I can go back in the office and populate paths that are between those garden beds. And once we get the base map, I can go back and put fences, buildings, all that sort of stuff, and the little red dots are all the trees that we had from the tree inventory. I’ve got a lot of work ahead of me.
This is my, pretty much rundown of that workflow. First, check the weather. Even though these devices are weather-resistant, I’m not going to be taking this out in heavy rain. I’d rather go trim the bushes and things like that. So, again, collect the polygon of the outside borders, and once I have the garden beds I populate the paths. I download the web map after every event. It’s really easy to accidentally pick up a polygon and shift it, so it’s always nice to back that up on ArcMap. And then, again we’ve started populating the base map with utilities and infrastructure because one of the things I didn’t mention is a lot of our knowledge of the underground infrastructure is in the institutional knowledge of our workers. We’ve been fortunate to have workers who’ve had their whole careers with us, but now they’re all starting to retire. One of the gardeners, who just recently retired 1st of July, had captured all of his irrigation box locations, which weren’t on any map, accurately at least. The next step I would like to do is add hyperlinks to all our CAD drawings as-built maps, and images of the hand-drawn maps which we have digitally collected on our servers, and then, again, go back to update the initial tree inventory from 2015.
The results I’ve got, I probably have about fifteen per cent of the zoo. I did a little bit of work since that last image. We have submeter base maps, which are more than adequate for our use. I’m hoping to have all of the facilities and the horticulture team have access to these maps on their mobile devices. Also, the public, once we get together a lot of the additions for the public to look at. And then the animals not being disrupted, which is a big plus, makes me look good with the keepers. Eventually, I would like to have a public garden map put together with actual more information on the plants that we do have at the zoo. And we’re probably going to get some interns hopefully in the next few years, to come and collect that data for us.
More articles


