Terrestrial Laser Scanning in Forest Inventories
Terrestrial laser scanning (TLS) is an effective technique for acquiring detailed tree attributes in forest plots. During the last two decades, national mapping agencies, companies, universities and research organisations have put tremendous effort into developing methods for tree attribute estimation using TLS. There is, however, still a lack of proper understanding on TLS performance. Different data collection methods and processing standards have led to a large range in tree detection and measurement accuracy. This article explains the early results of an international benchmarking initiative for TLS methods in forest inventories. The study has identified important differences in methods that should lead to operational work guidelines.
Measuring Tree Attributes
A terrestrial laser scanner automatically documents its surrounding environment in three-dimensional (3D) space with millions to billions of 3D points. In forestry, TLS is an effective technique for measuring forest plots and is anticipated to be used in national forest inventories, leading to more sustainable silviculture and savings for forest owners and industry alike. During the last two decades, significant research has been conducted on developing best practices around TLS for forest inventorying – to evaluate, for example, whether one scanning position at the plot centre (single scan) or several scanning positions inside and outside of the plot (multi-scans) should be used to measure a sample plot and estimate tree attributes (tree height, diameter, taper, crown width).
Impressive results have been reported in recent years that are automatic, repeatable, accurate for practical applications and comparable to results from national allometric models. There is, however, still a lack of proper understanding on TLS performance, especially in forests with varying structure and development stages (complex forest structures). Currently, the results obtained from TLS data for plot-wise tree attribute estimation have varied significantly from study to study. The percentage of correctly detected trees from reported multi-scan data has ranged from 50 to 100%. The differences between varying detection rates arise from different TLS hardware, scanning set-up, forest structures and processing methods.

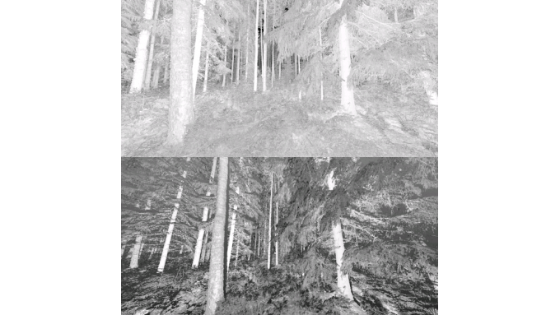
Figure 1, Single-scan TLS data of a forest plot in (top) a 2D matrix and (down) a 3D point cloud.
Benchmarking Study
To clarify the current status of the TLS application in plot inventories, an international benchmarking study was launched in 2014, led by EuroSDR and partly funded by the European Community’s Seventh Framework Programme Project Advanced_SAR ([FP7/2007–2013] under grant agreement No. 606971). The main objective of this current benchmarking study is to understand recent developments of TLS methodologies in plot inventories by comparing and evaluating the quality, accuracy and feasibility of the automatic and semi-automatic tree extraction methods based on TLS data. The specific sub-objectives include studying the accuracy and feasibility of various methods at the same test site and, in particular, to describe the effect of plot characteristics on individual tree extraction and to assess the difference between results from single- and multi-scan data collection approaches.

Figure 2, The parameters studied in the TLS benchmarking study: the position, diameter at the breast height, stem curve and tree height of an individual tree and the digital terrain model of the forest plot.
This study involves and supports more than 20 participating national mapping agencies, companies, universities and research organisations, which have developed their own processing methods or modified existing methods. Meanwhile, the study is also open for techniques still in the research phase. Each participant uses the same dataset to measure tree position, tree height, the diameter-at-the-breast-height (DBH), stem curve (stem diameter as function of height) and digital terrain model (DTM). Results from all the partners are evaluated using the same reference data and methods. Figure 2 illustrates the parameters studied.
Benchmarking Tests
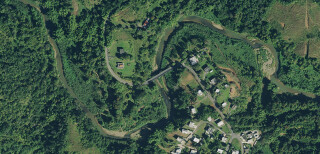
The test data was collected from 24 forest plots, located in a southern boreal forest in Evo, Finland (61.19ºN, 25.11ºE) in the summer of 2014. There, the main tree species are Scots pine, Norway spruce and silver and downy birches. Each plot had a fixed size of 32 x 32m. The test forest plots varied in species, growth stages and management activities including both homogenous and less-managed (and therefore less-homogenous) forests. Figure 3 shows two forest plots with clearly different structures. The forest in Figure 3(a) is dominated by pine trees on a flat terrain. There are 50 trees with a mean tree height of 19m. The forest plot in Figure 3(b) is more complex due to the steep terrain and having plenty of young trees. There are 168 trees with a mean tree height of 12m. The point cloud data was down-sampled to every fifth point to visualise the varied forest stand situation.

Figure 3, Two forest plots with clearly different structures. (Top) A forest plot on a flat terrain, dominated by pine trees. (Below) A forest plot on a steep terrain, with mixed tree species and plenty of young trees.
Five scans were made in each plot – at the plot centre and in north-east, south-east, south-west and north-west directions. Using five scanning positions in the multi-scan approach is a typical data-acquisition set-up which is a trade-off between the field scanning cost and the data quality (the merged TLS point cloud normally covers all trees within the forest plot). The test data included both single-scan and multi-scan TLS data. The centre scan was used as the single-scan data. All five scans were also registered using reference targets and merged as the multi-scan data (Figure 4).
The Finnish Geospatial Research Institute (FGI) is currently responsible for overall project management, including the general coordination, collection and distribution of all the data, and the evaluation as well as publication of the results. Preliminary test data became available for partners in February 2015. So far, 23 international partners, including six from Asia, 13 from Europe, three from North America and one from Oceania, have received the data and 12 partners have submitted their results. The methods in benchmarking show a high level of automation and are providing results at reasonable accuracies.
Evaluating the Results
The study is now in the evaluation phase. Using standardised data and evaluation methods, the extraction of tree positions, tree heights, DBH, stem curve and DTM were evaluated. The current results show variances between methods and data collection approaches. Figure 5 shows the averaged root mean square errors (RMSEs) of DTMs from all the participants in each test plot. The results from single-scan and multi-scan data are marked in red and blue, respectively.

Figure 4, A forest plot in the single-scan (left) and multi-scan terrestrial laser scanning mode (right).
As expected, the single-scan results are clearly less accurate than those from the multi-scan data. Clear variances are also noticeable between forest plots under different forest conditions, as well as between study partners. When building a DTM from the multi-scan TLS, the results showed a mean RMSE at 12.7cm, the minimum at 6.5cm and the maximum value of 28.9cm; for the single-scan TLS, they are 32.3cm, 8.5cm and 101.3cm, respectively (greater error). As for the best-performing participant, the mean RMSE of the DTM is 7.5cm, the minimum is 4.5cm and the maximum is 13.0cm when using the multi-scan data; for the single-scan data, they are 21.3cm, 7.9cm and 52.8cm respectively (greater error).
Outlook
The other extracted parameters such as tree position, tree height, DBH and stem curve are under evaluation and the results will be published in detail in future study updates. The final report of the study is expected to be published by June 2016. The TLS data used in this benchmarking study will remain available to everyone for further research purposes. The results will not only summarise the state of the art of automated TLS plot inventory methods, but will also lead to guidelines for operational work. Hence, this study will shape the future application and identify necessary research steps so that traditional analogue forest inventory methods can one day be replaced by TLS-based methods.
For an overview of terrestrial laser scanners currently available on the market, visit geo-matching.com.
Additional Information
EuroSDR International TLS Benchmarking Project webpage.

Figure 5, The averaged RMSEs of DTMs from all the participants in each test plot.
Do you have questions about this article?
Get in touch with RIEGL | Innovation in 3D, and they would be happy to answer any questions you have about pricing, suitability, availability, specs, etc.


