Technical valuation of Sidescan Sonars: Marine Sonic Scout 300/900 vs 2025 Edge Tech 230/850E
This document is an initial study comparing the performance of two commercially available U.S. side-scan sonar systems, a Marine Sonic Scout 300/900 and the 2025 Edge Tech 230/850. Both systems are designed for use with autonomous underwater vehicles (AUVs). The objective of the study was to evaluate the side-by-side performance of the two systems with the aim of identifying the system representing the best value taking into consideration both price and performance including quality of the recorded data and imaging capabilities.
Side-scan sonar comparison
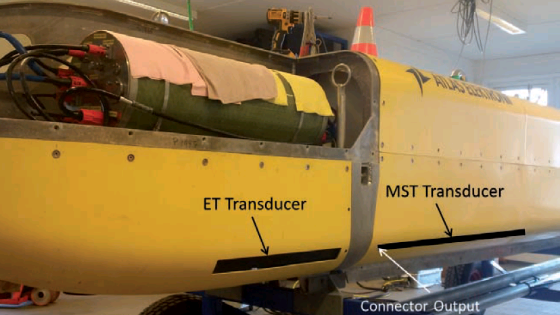
The two side-scan sonar systems, a Marine Sonic Scout 300/900, hereinafter referred to as MST, and the 2025 Edge Tech 230/850, hereinafter referred to as ET, were installed aboard an Atlas Elektronik AUV as shown in Fig. 1. The ET transducer array was mounted in front of the MST transducer array on both sides of the vehicle. Both systems were capable of simultaneous dual- and/or single-frequency modes of operation. Both sonars were mounted with a downward looking angle of 10° (relative to the horizontal axis).
As both sonars operated in a similar frequency domain, different mission profiles were used depending on whether the sonars were operated simultaneously and separately. There was no application
of acoustic management. The goal is a basic review of the performance and the quality of the recorded data and the imaging capability. Observed interferences were not a factor during the testing.
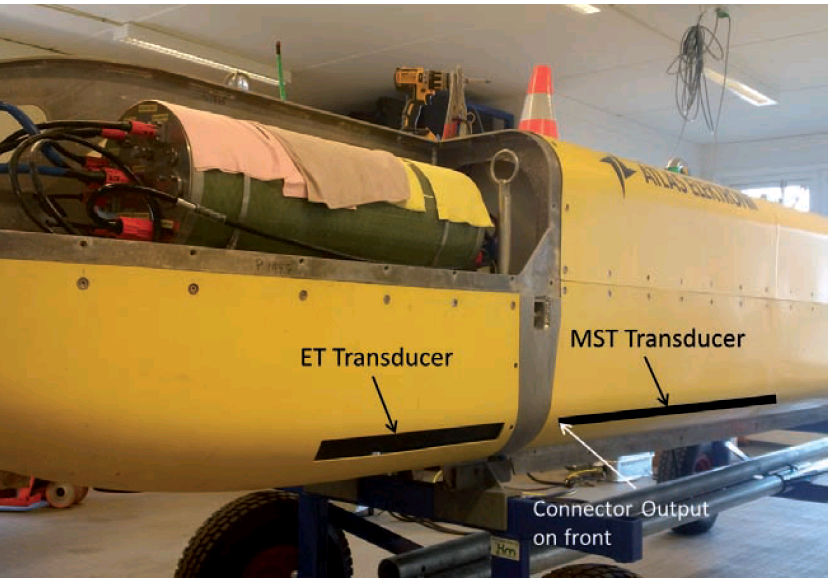
Fig. 1: Mounting of the sonars on the AUV
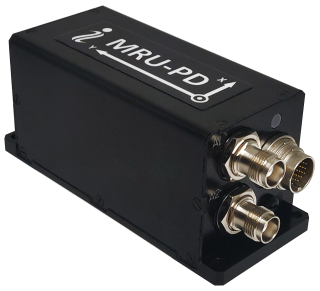
Marine Sonic Technology Side-scan Sonar System
Hardware:
Software:
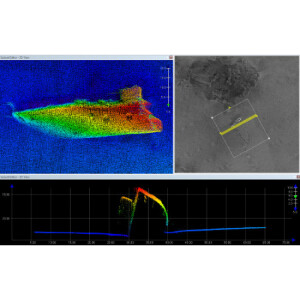
MST software provided a user interface with a wide variety of options including data replay, target marking and report generation. The system simultaneously provided both high- and lowfrequency
data in a waterfall display with an additional tote displaying the survey path and vehicle position (Fig. 2). Data mosaicing was not available.
Replay mode operated in either forward or reverse with user defined replay speeds. The system includes target marking a very useful feature when analysing data covering the same target during different survey lines. When the sonar-swath passed over the target, the marker reappeared and alerted the operator. Data conversion was also included. Data was converted to the XTF format in real time without waiting for the data replay to finish. This represented considerable time savings during longer missions.
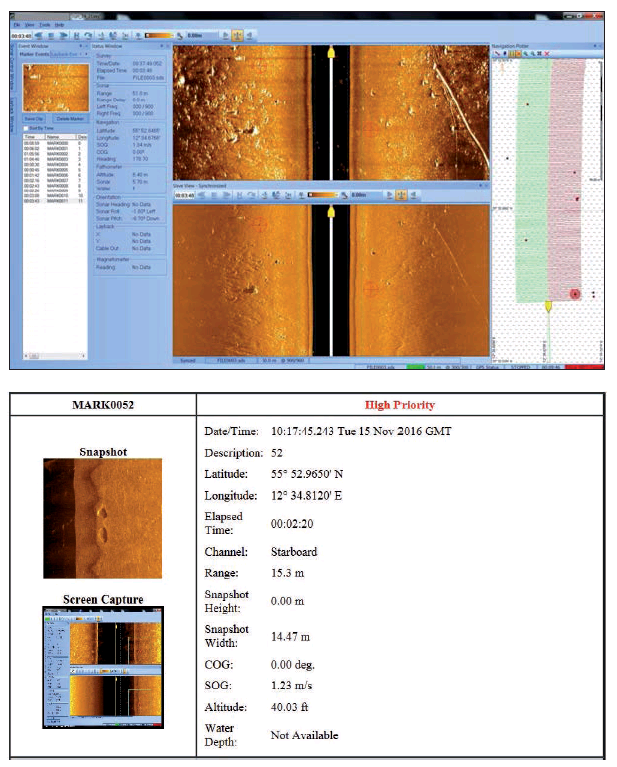
Report generation was automatic with the data provided in an HTML file that included all information for any operator marked targets including a snapshot of the target as it appeared in the high/low frequency waterfall display, the coordinates, the elapsed time and the size of the area in the snapshot. Useful for further data processing, the report also significantly reduced any need for the operator to manually record data (Fig. 3).
Fig. 2 and 3: MST software main window and MST target report
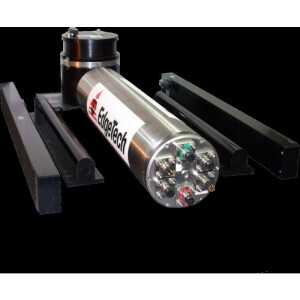
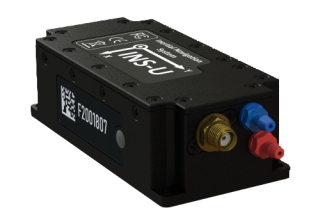
Edgetech Sidescan Sonar System
Hardware
ET had a built-in processing unit that pre-processes the input time signal and calculates intensity values (thus achieving slightly higher resolution).This additional processor, however, resulted in a significantly higher power consumption rate than that of MST.
Software:
ET software provided a user interface offering limited data replay options (Fig. 4) The system simultaneously provided both high- and low-frequency data in a waterfall display. Data mosaicing was not available. Replay mode operated only in forward, limiting the operator’s ability to conduct file parsing when a specific target becomes visible in the water column. Data conversion to an XTF format was only available in the data-replay mode at a maximum of 20 times the real time. The user was allowed to define the maximum size of the parsed XTF files, and whether or not automatic Time Varying Gain (TVG) was integrated into the data.
Testing:
Both sonar systems save the raw data in a format developed or specified by the manufacturer.
MST raw data saved in a proprietary, 24-bit integer SDS format. MST played the data on-line and replayed it off-line. There was also an option to convert and save the data in XTF format. For reducing
the file size the sampled data in the XTF format was compressed to 16-bit. ET raw data saved in a producer specified, 16-bit integer JSF format. ET replay was in the off-line mode data converted to standard XTF format.
For hydrographical analysis, there are commercial software modules capable of reading the standard XTF format.
There were three different on-water survey scenarios:
• Both sonars operating simultaneously dual mode;
• MST sonar ON (while operating at a single mode), ET sonar OFF;
• ET sonar ON (while operating at a single mode), MST sonar OFF.
The surveys were conducted at two different altitudes
(height over ground, HoG):
• 3 m HoG range set to 30 m for both modes;
• 5 m HoG range set to 50 m for both modes.
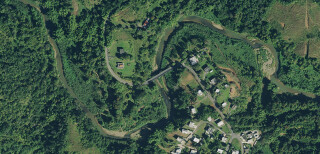
Scenarios were executed in the Port of Rungstedt, Denmark in November 2016. Average water depth was 14 to 17 m, and strong currents were present.
There were four artificial targets: a plastic pipe, a hose, a mine-like shape and one steel/wood frame (1 m³). In the surveyed area, there were many targets of opportunity imaged by both sonars at both frequency modes. In the first stage of the data comparison, only artificial targets were used, since their size and condition was known. In the second stage of the comparison, because of the high number, only the unknown (visible) objects were selected.
Two different approaches were used for the data
analysis:
• Data analysis based on sonar images using
standard hydrographic software.
• MATLAB based quantitative data analysis conducted
on the raw (amplitude) data.
During each mission, the area of interest was surveyed twice; once north-south, and once southnorth. For the analysis, only north-south tracks were used as current effects on the AUV’s motion
in the opposite direction were significant.
Data processing was done via Teledyne’s Caris SIPS 9.1.9 and 10.1. The ET JSF data was imported directly into the processing software. Since the SDS format of MST data could not be imported
directly, MST system software was converted into XTF before being imported.
Read the complte article from the Journal of Hydrography and Geoinformation here


