Rotterdam Port Survey with QPS QINSy Hydrographic Survey Software
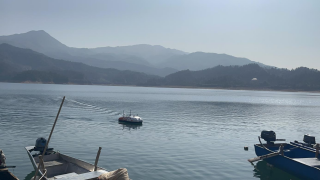
The Port of Rotterdam is a leading global port and by far the largest seaport in Europe. The port is situated in the Rhine delta and with its direct connection to Europe’s largest industrial region, the Ruhr area, it is a key entry point to the European market. Understanding the depths throughout the 40km of the port’s waterways is critical to the day-to-day running of the port.
Because the Netherlands Hydrographic Office only produces Electronic Navigation Charts (ENCs) for harbour usage, the port investigated the possibility of producing ‘Berthing’ ENCs containing high-density depth data to support decision-making within the port.
The Port of Rotterdam started a pilot project to produce S-57 ENCs of the area covered by the port more than ten years ago. The goal of this project was to produce daily high-density ENC updates that incorporated daily hydrographic surveys of the area. This product was to contribute to efficient port planning by taking advantages of accurate depth data and available ‘over-depth’ in the port’s basins and fairways, which minimise under keel clearance (UKC) requirements. The ‘over-depth’ is the vertical distance between maintenance and actual dredged depths when the actual bottom is deeper than the maintenance depth.
It took nearly three years to take the high-density ENC into production due to many conversion tools that had to be developed and performance problems in creating depth areas at a contour interval of only 10cm.
In 2013, the port partnered with Esri to implement PortMaps. PortMaps, built by using the ArcGIS platform, is not only an asset management system, but also provides the framework for hydrographic production. The core element of PortMaps is the ENC production module built around QPS Qarto.
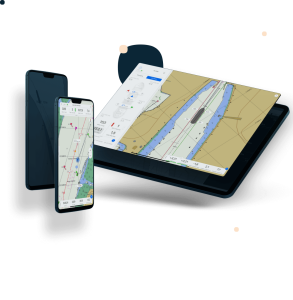
PortMaps went live in 2015. Nowadays, harbour masters, asset managers and marine pilots have access to the data needed, via Esri Maritime Chart Server (MCS). MCS provides the port with the most recent ENCs available, including ENCs created with depth information surveyed that same day. The port operates a fleet of dredgers to keep the port open all year and for safe navigation. In addition, two survey vessels, equipped with the latest multibeam echo sounder systems, survey the port. It is not uncommon for three surveys to be conducted per day.
Hydrographic Survey with QPS QiNSY Software
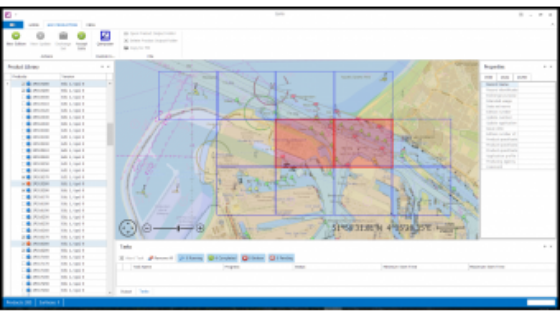
Hydrographic surveys of the port are conducted daily according to a survey plan generated from siltation rates. The port operates two survey vessels equipped with the latest multibeam echo sounder systems and with the help of QPS QINSy.
The multibeam surveys contain overlapping tracks to distinguish seabed objects from unwanted noise/spurious soundings. The survey data is processed onboard the vessels on the same day to a 1x1 metre grid. On slopes of bottom protection rock dump areas, a mean of 0.5x0.5 metre grid is created to maintain detail of the seabed. Once the survey has been fully processed it is sent to the Data Management department as a clean digital terrain model (DTM). The survey vessels are connected to the Port of Rotterdam local network by high speed connections. The surveys are copied to the network drive which is monitored by the PortMaps data team. The Data Management office converts the DTM from an ASCII file into a GeoTiff containing two bands: depths and date of survey. After a quick visual inspection, the GeoTiff is registered with the ArcGIS BIS.
The port maintains a compete bathymetric surface model for its jurisdiction using the ArcGIS for Maritime solution. When new surveys are registered with the BIS they are overlaid onto the existing data into a seamless bathymetric surface based on a set of filters and rules. The ArcGIS for Maritime solution uses ArcGIS mosaic dataset functionality to combine the individual surveys into a seamless surface based on the rule ‘most recent surveys data on top’. The Port of Rotterdam’s surface model is updated daily with the latest surveys to ensure the most up-to-date data is included in the port ENCs.
The survey data recorded by the port’s survey vessels are not only used to produce ENCs but are also used by the port’s dredging team. Their task is to analyse the survey data against a port design model. Products like surface difference charts and volume reports are generated to monitor the siltation of the port. This information is used to instruct the dredging vessels where the maintenance dredging is required. This process will guarantee the port’s accessibility 24/7.
Do you have questions about this case study?
Get in touch with QPS, and they would be happy to answer any questions you have about pricing, suitability, availability, specs, etc.


