Mobile Lidar Corridor Mapping - Challenge: Hurricane Damage Control
In August, 2005, Hurricane Katrina devastated the Gulf Coast of the United States, leaving in its wake an unprecedented loss of life and property damage. Among the critical infrastructure the storm impacted was the levee system that controls the Mississippi River's flow around the city of New Orleans.
Meeting the Challenge
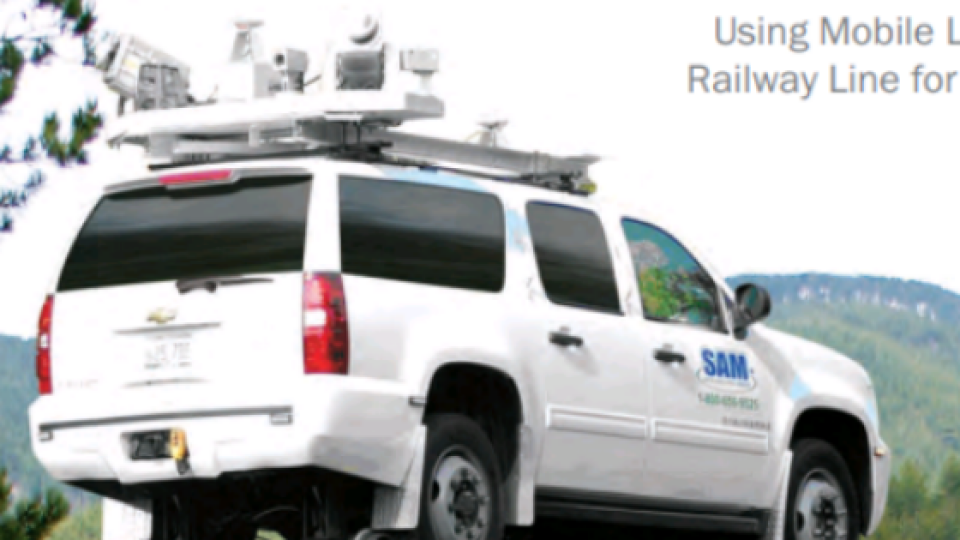
Tracking and evaluating rail-side assets has long been an ongoing challenge. Collecting this type of data has required field crews using tripod-mounted survey equipment. Not only is this method slow, but it also exposes surveyors to potential hazards and disrupts the operation of the rail line. Now, the growing use of mobile lidar mapping provides a faster, safer alternative.
Recently, a trial was conducted by SAM, Inc., in cooperation with the Austin Texas Transportation Authority, to survey a section of public rail line that runs from downtown Austin north to Leander. The purpose was to test a mobile lidar system for carrying out an asset inventory of rail-side hardware and engineering design work, including the evaluation of as-built structures. The survey inventoried 64 route miles of track, including sidings and rail yards.
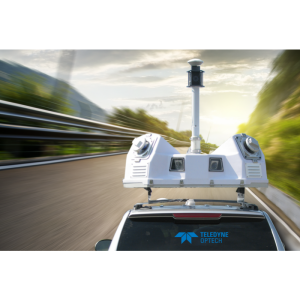
Lynx Mobile Mapper
The lidar instrument tested was the Lynx Mobile Mapper, manufactured by Optech Incorporated. This mobile system collects survey-grade lidar and image data from a vehicle moving at traffic speeds. In this study, the Lynx was configured with two lidar sensors, each collecting georeferenced 3D spatial data at a rate of 200 kHz. It also used two 5-Megapixel cameras triggering at a rate of 3 FPS. The Applanix LV 420 Position and Orientation System (POS), with an LN200 Inertial Measurement Unit (IMU), was incorporated to provide trajectory information for the lidar sensor data.
The Survey: Pre-Planning
The survey began by surrounding the design engineering collection area with four GPS base stations. These stations, combined with GPS data obtained through the Continuously Operating Reference Station (CORS), were set up to create a Virtual Reference Station (VRS) network to correct and refine the GPS position of the vehicle’s onboard POS. Throughout the survey the baseline between the Lynx Mobile Mapper and the base stations did not exceed 18 miles.
The Survey: Execution
Once data for calibrating boresight angles and measuring lever arms was acquired, the vehicle drove to a road/rail crossing where the hi-rail gear was engaged. The survey was conducted over a period of 10 hours. The route was driven both south to north and north to south. Survey driving speed in urban areas was between 15 and 20 mph, and in rural areas 25 to 30 mph. During the survey, the POS was monitored to identify periods of GPS outage, which occurred in areas of heavy vegetation and urban canyons. These areas were logged in field notes and on route maps.
The Survey: Post-Processing
After data collection was complete, all data was sent for post-processing, which involved three basic steps: 1) raw GPS and POS data were processed using POSPac; 2) lidar data was processed using Optech’s DASHMap software; and 3) the output of POS-corrected lidar data was integrated into GeoCue’s Mobile CuePac. This, in turn, used the program TerraMatch to fit the lidar data point cloud to the control targets.
Two separate adjustments were made to the lidar data. The first aligned all collected data to the control; the second concentrated on areas where engineering design work would be performed.
After the lidar data had been adjusted to the control data, classification of the collected data began. Classification and vectorization of the design engineering area took a total of 100 hours.
Applying the Survey Data
Establishing survey accuracy in the design area is essential to the design process. Having established an estimate of the overall positional error in the Lynx data, measurements could be produced from the point cloud with confidence. This phase of the project focused on two aspects of design work: calculating clearance envelopes in both the vertical and horizontal directions, and mapping as-built bridges along the rail line.

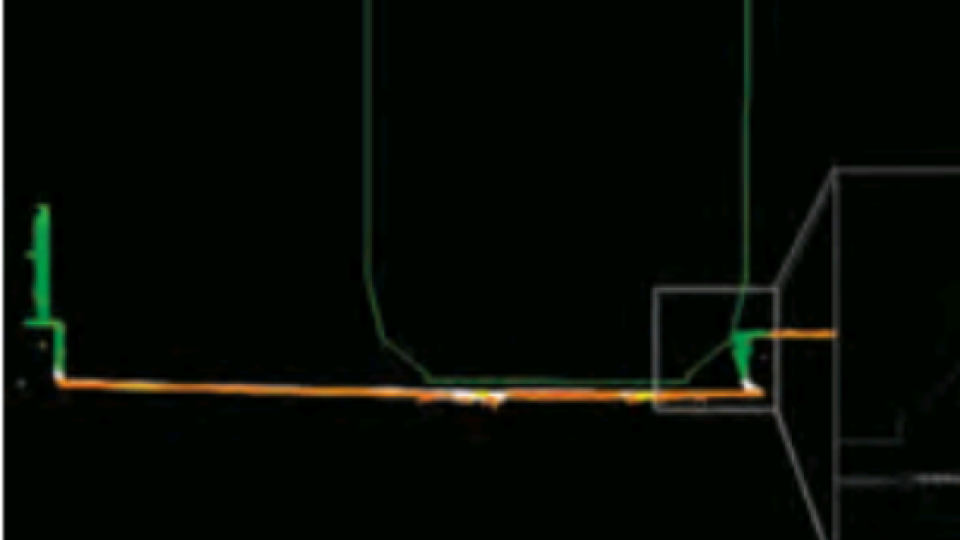
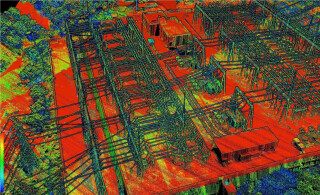
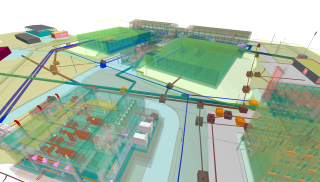
Cross-section of Lynx data point cloud, showing horizontal clearance envelope (image courtesy of SAM, Inc.).
Minimum, standard, and maximum vehicle sizes that can use the rail system have to be accommodated in the design. When existing infrastructure requires upgrading, the current as-built design has to be evaluated so that an upgrade plan can be made. To this end, dimensionally accurate 3D data is invaluable in planning a transportation system upgrade. The horizontal clearance of rail cars needs to be assessed based on protrusions onto the track area. The figure above shows that the platform intrudes on the clearance envelope, indicating a problem with the design.
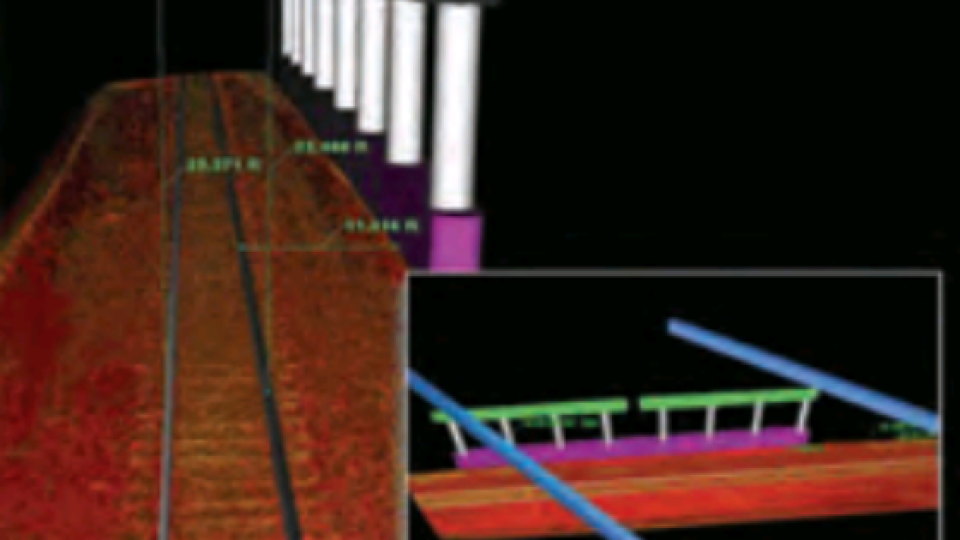
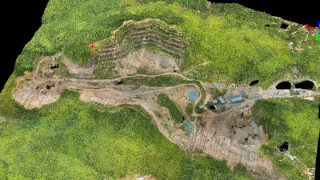
Existing as-built designs of bridge and tunnel structures along the track also had to be evaluated, as shown below. This information is critical in determining whether a) a second track can be laid under the existing bridge structure simply, safely and at little cost; or b) if a new track section will require a complete bridge redesign.Existing as-built designs of bridge and tunnel structures along the track also had to be evaluated, as shown below. This information is critical in determining whether a) a second track can be laid under the existing bridge structure simply, safely and at little cost; or b) if a new track section will require a complete bridge redesign.

Timely, Reliable, As-Built Maps
Nearly 1 terabyte of data was collected. Ground truthing was performed to verify the adjustments made in TerraMatch. Residuals of 0.04 feet horizontally, and 0.06 feet vertically, were computed. The lidar data point clouds produced from the Lynx Mobile Mapper were feature-rich and contained high-quality data to be used for a variety of purposes. The data could be adjusted to meet the project’s accuracy specifications, and produced timely, reliable, as-built maps of the design corridor. The rest of the data collected along the survey route was useful in extracting asset data, which was subsequently incorporated into a GIS database of railway assets, directions, and as-built bridges along the rail line.
Do you have questions about this case study?
Get in touch with Teledyne Geospatial, and they would be happy to answer any questions you have about pricing, suitability, availability, specs, etc.

Related products


