Autonomous Nutrients Systems Help to Understand Sources of Nutrients Within the St. Lucie Estuary
Autonomous nutrient monitoring systems add a new dimension to the analysis of coastal ecosystems. Tracking water masses and exchange processes in estuaries is critical to understanding how estuarine ecosystems work and predicting responses to both routine and extreme events. While salinity and dissolved organic matter (DOM) fluorescence can be treated as conservative tracers of seawater and freshwater, they are not necessarily sufficient to differentiate all freshwater sources. In particular, anthropogenic impacts such as nutrient runoff and point source inputs are not necessarily correlated with fluorescent DOM loading.
To monitor and predict impacts from excess nutrient loading, the nutrient concentrations need to be measured. However, in the dynamic environments of estuarine and coastal systems, spot sampling of nutrients is rarely sufficient or economically practical to yield significant results. The development of reliable in situ nutrient measurements, coupled with near real time data reporting, now allows for observational data collecting at the relevant time scales needed to assess environmental impacts. Real-time nutrient data can be used to evaluate water quality and potential negative impacts such as harmful algal blooms, eutrophication, and low oxygen events.
The St. Lucie Estuary suffered from a severe harmful algal bloom in the summer of 2016. The crisis was widely reported and triggered a state of emergency. The popular media routinely blamed the algae bloom on nutrient input from Lake Okeechobee. Because the estuary is monitored with a real-time data network, this hypothesis was testable during the crisis. In this whitepaper we demonstrate how data broadcast from the St. Lucie Estuary by Florida Atlantic University’s network of sensors is used to monitor the outflow from Lake Okeechobee and determine whether it caused severe algae blooms in the estuary.
IRLON Data System
Florida Atlantic University’s Harbor Branch Indian River Lagoon Observatory Network of Environmental Sensors (IRLON) consists of LOBO Land/Ocean Biogeochemical Observatory (http://www.seabird.com/lobo) units and weather stations at ten sites throughout the Indian River Lagoon system, including five sites in the St. Lucie Estuary (Figure 1). IRLON provides real time water quality and nutrient data. The LOBO’s are equipped with a suite of physical and biogeochemical sensors that record and transmit data on half hour intervals to the Florida Atlantic University’s LOBOviz dedicated interactive website (http://fau.loboviz.com/cgi-lobo/lobo). This new capability gives scientists, water quality managers, and the public the ability to observe current conditions and plan for the future.

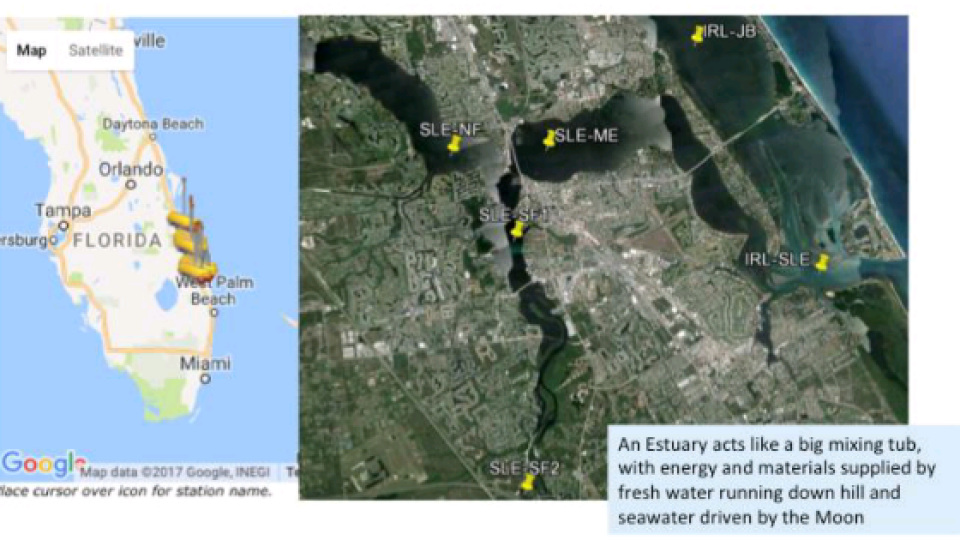
Fig. 1. IRLON sites in Southeast Florida discussed in this white paper (left panel) and locations of the LOBO systems in an area of the harmful algal bloom in 2016. The data analysis presented here concentrates on the St. Lucie Estuary sites, including the location near the connection to the ocean (IRL-SLE). The outflow from Lake Okeechobee is through the St. Lucie Canal which enters the estuary near the SLE-SF2 LOBO site. The other source of fresh water to the estuary is the watershed to the northwest that is not connected to the lake; the LOBO at SLE-ME sees the bulk of this flow.
Water Quality and Nutrient Sensors
Water quality and nutrient sensors can help determine changes in St. Lucie estuary’s freshwater sources and mixing dynamics; sources of water in the estuary can be identified by signature nutrient and water quality properties. Nutrients are monitored with SUNA Nitrate and Cycle-PO4 instruments deployed on the LOBO system. The SUNA Nitrate instrument is an in-situ UV spectrophotometer that determines nitrate concentration by an inversion of the UV absorption spectrum. The Cycle-PO4 is an in situ dissolved phosphate analyzer that uses the molybdate wet chemistry technique to measure phosphate concentration. The backbone of the LOBO system is Sea-Bird’s WQM water quality monitor which includes salinity, temperature, pressure, chlorophyll fluorescence, and backscattering/turbidity sensors. In addition, the IRLON LOBOs have Sea-Bird CDOM fluorometers to measure the fluorescent dissolved organic carbon concentration.
This analysis of the IRLON data relied on discussions and previous work by Harbor Branch’s Brian Lapointe and Dennis Hanisak. The live data and the ability to quickly visualize the data were instrumental in the analysis, demonstrating that live data can be crucial for crafting the appropriate response during a crisis.
Water Masses and Mixing Dynamics
Salinity and CDOM
Estuaries are environments where seawater and freshwater mix when the tidal cycle pushes seawater into coastal embayments. Because the concentrations of salt and dissolved organic matter (DOM) are highly weighted towards their individual sources, salinity is an effective tracer of the seawater input to the estuary while DOM traces the freshwater input. By comparing salt and dissolved organic matter in the estuary, we can determine whether the estuary contains water from Lake Okeechobee, the sea, or terrestrial runoff.

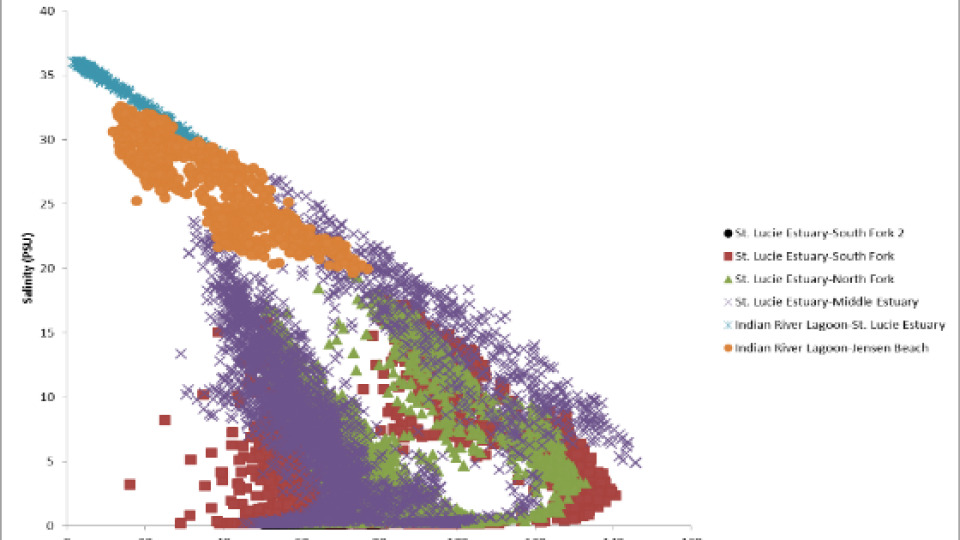
Fig. 2. Property-property plot of salinity and CDOM (colored dissolved organic matter) concentrations at IRLON sites in the St. Lucie Estuary from January through May of 2016. The circles denote the observed endmembers in the system: seawater in the upper left, Lake Okeechobee Canal freshwater input in the lower center, and inferred runoff and other fresh water sources in the lower right.
IRLON measures the DOM concentration using CDOM (Colored Dissolved Organic Matter) fluorometers. Dissolved organic matter and salinity concentrations are generally inverse of each other in the coastal environment (Figure 2). Seawater has very low DOM levels compared to freshwater because seawater is isolated from large sources of organic matter (blue circle in Figure 2), labile DOM is consumed by the microbial community, and both refractory and labile DOM are broken down by sunlight in the surface layers of the ocean. Freshwater, especially in coastal environments, is replete with DOM because there are abundant sources of organic matter such as forest litter, soils, and agricultural run-off (red and green circles in Figure 2).
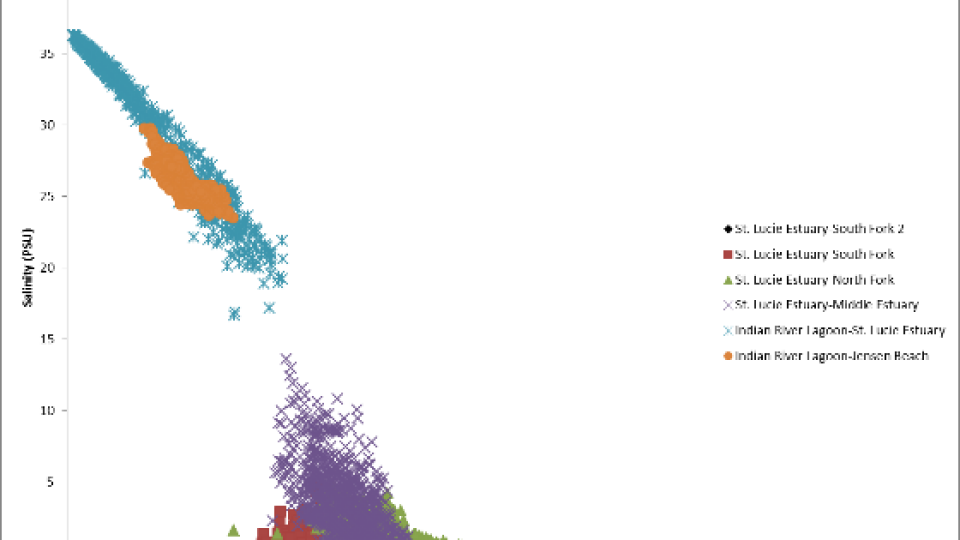
An example of a period of high runoff is shown in Figure 3. In January of 2016, there was high rainfall but very little water released from Lake Okeechobee, so the water in the estuary was primarily supplied by the ocean and surface runoff.

Fig. 3. The same property-property plot of salinity and CDOM (colored dissolved organic matter) concentrations at IRLON sites in the St. Lucie Estuary as in Figure 1, but limited to only data from January, which was very wet (> 10 inches of rain versus a normal 2.5 inches).
The period during the HAB crisis is shown in Figure 4. From June through July 7, there was little rainfall and relatively constant release of water from Lake Okeechobee into the canal feeding the South Fork. Two additional phenomena stand out: very little saltwater reaches the upper estuary basins (South Fork and North Fork) and the influence of runoff is reduced. In the estuary this manifests as freshwater input originating from Lake Okeechobee, low mixing of seawater, and increased residence time of high-nutrient freshwater.

Fig. 4. The same property-property plot of salinity and CDOM (colored dissolved organic matter) concentrations at IRLON sites in the St. Lucie Estuary as in Figure 1, but limited to June through July 7 during which there was little rainfall and relatively constant release of water from Lake Okeechobee into the canal feeding the South Fork.
Nutrients and CDOM
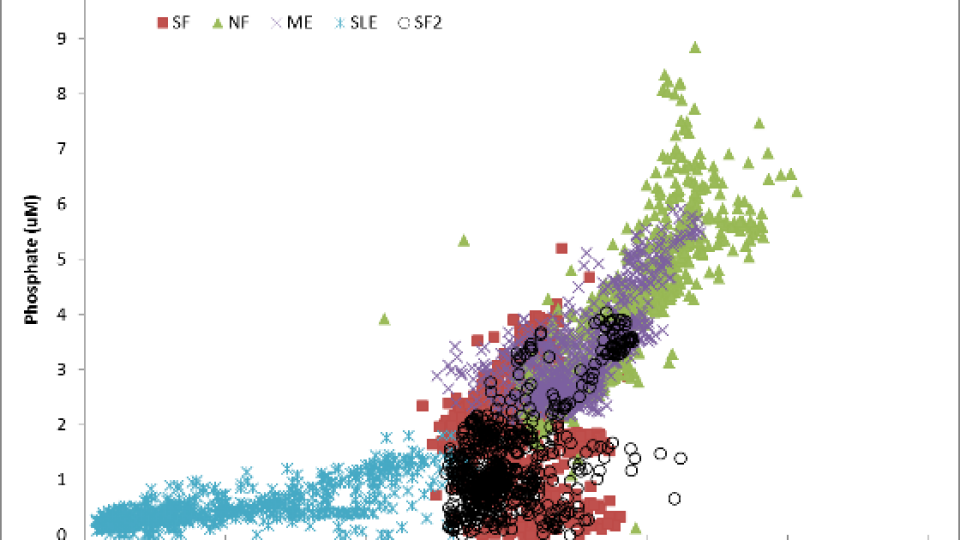
In the St. Lucie Estuary, the nutrient loading is almost entirely from inland sources and carried into the estuary with the fresh water. Accordingly, plotting the phosphate concentration measured by the Cycle PO4 against the CDOM concentration will demonstrate the sources and pathways of the nutrients in the estuary (Figure 5). While both phosphate and nitrate are necessary for plant growth, phosphate is tracked here; elevated phosphate concentrations with respect to nitrate are associated with blooms of blue-green algae.
Lake Okeechobee water in the South Fork had relatively low nutrient concentrations during the crisis. The North Fork has the highest concentration of phosphate as well as CDOM. The nutrient input from both Lake Okeechobee and seawater is dilutive with respect to the North Fork concentration, indicating that Lake Okeechobee was not a significant source of nutrients relative to concentration during this time. It is clear from the CDOM and phosphate relationship in the estuary that although water from Lake Okeechobee was entering the estuary, it was not supplying an excess of phosphate such that it was likely to cause the harmful algal bloom.

Fig. 5. Property-property plot of phosphate and CDOM (colored dissolved organic matter) concentrations at IRLON sites in the St. Lucie Estuary in June and early July of 2016 during the HAB crisis. The circles are the freshwater and saltwater endmembers from Figure 2, based on the CDOM concentration.
Further Research
While news reports indicated that nutrients from Lake Okeechobee were responsible for the 2016 harmful algal bloom, the IRLON real-time sensor data suggests that freshwater input from the lake was dilutive to the nutrient concentration in the estuary. Instead, it appears runoff entering the North Fork was the dominant source of nutrients at the time of the bloom. Observations of discharge rates from Lake Okeechobee and seawater mixing in the St. Lucie Estuary indicate that circulation dynamics contributed to the bloom. High freshwater discharge from Lake Okeechobee decreased the penetration of seawater into the North and South Forks, effectively turning those parts of the estuary into a nutrient-rich lake. The resulting increase in the residence time of freshwater in the estuary most likely allowed the bloom to develop. Flow modeling and more real-time sensor platforms can help provide a clearer model of the estuary’s nutrient and circulation dynamics and allow for feedback from the estuary to inform management of the system.
For more information, see the SECOORA webinar presenting the St. Lucie IRLON data (http://www.seabird.com/walsh-webinar) and FAU Harbor Branch Oceanographic Institute’s presentation on IRLON and the harmful algal bloom analysis (https://www.youtube.com/watch?v=6l0BTnI6yhg).
The network is funded by the Florida Department of Environmental Protection, the South Florida Water Management District, the Save Our Seas Specialty License Plate, the Harbor Branch Oceanographic Institute Foundation and FAU Harbor Branch. For more information on the network, visit http://www.fau.edu/hboi/irlo/irlon.php.

Related products


